
In 2009, state and local governments brought in nearly $2.1 trillion, a 22.1 percent ($587.5 billion) decrease from 2008, according to statistics from the U.S. Census Bureau. Most tax revenue categories saw declines except property tax, which saw a 3.7 percent increase to $424.0 billion.
These findings come from the 2009 Annual Surveys of State and Local Government Finances, which include statistics on revenues (including taxes), expenditures, debt and assets (cash and security holdings) for state and local governments.
Revenue from the federal government increased 12.3 percent from $478.0 billion to $536.8 billion between 2008 and 2009. (See Table 1 [Excel])
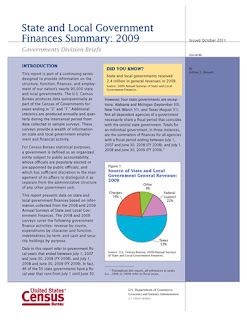
Spending increased 4.6 percent for state and local governments, totaling almost $3.0 trillion in 2009. Education continued to be the largest expense ($850.7 billion), followed by public welfare, which consisted of support of and assistance to needy people ($431.1 billion) and insurance trust ($275.5 billion). (See Table 1 [Excel])
Debt outstanding for state and local governments increased $131.1 billion (5.1 percent) to $2.7 trillion in 2009.
State and local spending on education comprised more than 33.0 percent of expenditures in nine states (Alabama, Arkansas, Georgia, Kansas, New Jersey, Texas, Vermont, Virginia and West Virginia). Elementary and secondary education totaled more than 24 percent of spending in New Jersey (25.8 percent) and Georgia (24.3 percent). Maine led the nation in state and local government spending on public welfare as a percentage of total spending (24.1 percent). (See Table 3 [Excel] and Table 4 [Excel])
For local governments, property tax revenue was up 3.7 percent to $411.0 billion. Public welfare spending increased 2.1 percent for local governments, led by vendor payments (payments to private vendors for medical care, hospital care, and other goods and services provided to needy people), which jumped 11.5 percent to $6.3 billion in 2009. Spending on utilities increased 6.4 percent, led by transit spending, which increased 13.8 percent. (See Table 2 [Excel])
Other highlights for state and local government finances:
- Unemployment compensation saw an 86.0 percent increase from $35.6 billion in 2008 to $66.2 billion in 2009.
- Insurance benefits and repayments increased 17.9 percent to $275.5 billion.
- Spending on administering social insurance increased 12.6 percent from $4.1 billion in 2008 to $4.6 billion in 2009.
- Revenue from individual income taxes decreased 11.3 percent from $304.9 billion to $270.5 billion.
- Corporate income taxes revenue declined 19.2 percent to $46.0 billion.
- Insurance trust revenue dropped 683.5 percent to $-498.0 billion, driven by employee retirement losses. Insurance trust revenue includes retirement and insurance contributions and earnings and losses on investment assets.
- Cash and security holdings decreased 15.0 percent to $4.6 trillion because of a decrease in employee retirement assets, which declined 23.8 percent in 2009.
- Spending on highways comprised more than 10.0 percent of expenditures in Alaska, North Dakota and South Dakota. (See Table 3 [Excel])
Data in this report are subject to sampling variability as well as nonsampling errors. Sources of nonsampling errors include errors of response, nonreporting and coverage. More details covering the design methodology are available online at <http://www2.census.gov/govs/estimate/2009_Local_Finance_Methodology.pdf>. All comparative statements in this report have undergone statistical testing, and unless otherwise noted, all comparisons are statistically significant at the 10 percent significance level.
Source: U.S. Census Bureau