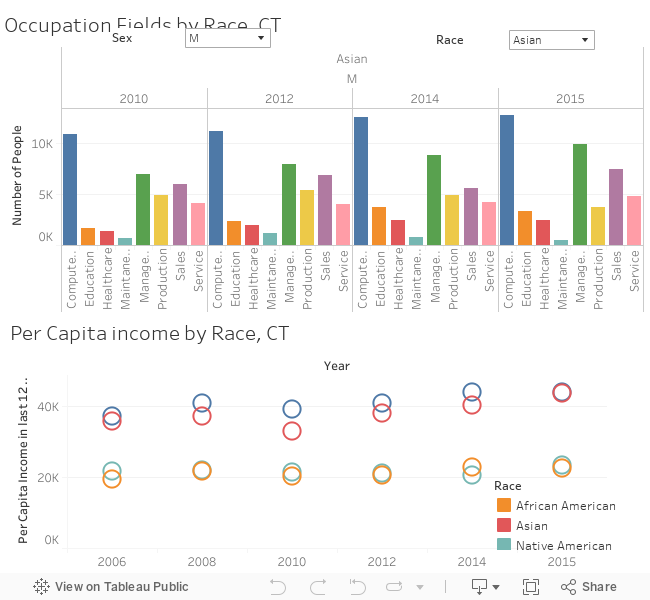
The following visualization is a comparison of per capita income of different races of civilians within Connecticut and then taking a look at the occupations that lead to a drop or increase of capita of each race group. This information was obtained from the American Community Survey 2006-2015.
Descriptions of each occupational group:
Management- business and financial operations occupations, management occupations.
Computer Sci- computer and mathematics occupations, architecture and engineering, life physical and social science occupations.
Education- community and social service, legal occupations, education, training and library, arts, entertainment, sports and media.
Healthcare- health diagnostics, technologists, technicians, and health practitioners.
Service- healthcare support, protective service, food preparation and serving occupations. building and grounds maintenance, and personal care.
Sales- sales, office and administrative support.
Maintenance- farming, fishing, forestry, construction and extraction, installation, maintenance and repair.
Production- production, transportation, and material moving.