Aerial Photography of Connecticut

On the left, UConn (Storrs Campus) in 1934; on the right UConn (Storrs Campus) present-day.

A recent blog post highlighted the new GIS Data Distribution Page on MAGIC’s website. In addition to the new look on this page, the Aerial Photography Page has been updated as well! Now, when you visit this page, you will find aerial photography of Connecticut from the following sources:

  • Connecticut Ecological Conditions Online (CT ECO) Aerial Photography Viewer
  • Connecticut Historical Aerial Imagery from MAGIC
  • Connecticut Historical Aerial Photography from the Connecticut State Library
  • Connecticut Historical Aerial Photography Mosaic Map Mash-Ups from MAGIC
A Screenshot from MAGIC’s CT Aerial Photography Mosaics Mash-Ups. The red marker indicates our location, Homer Babbidge Library. On the left, imagery from 1934, and to the right, Google’s current imagery.
The Connecticut Aerial Photography Mosaic Mash-Ups enable you to view, pan and zoom linked historical (1934, 1991, 2006, or 2008) and and contemporary imagery…check it out!

New York New Haven Hartford Railroad Valuation Maps

Years ago the New Haven Railroad Historical and Technical Association donated 3,000 +  railroad valuation maps to the Thomas J. Dodd Research Center at the University of Connecticut.  These maps depict the rail line and features adjacent from 1915 – 1916 for the states of Connecticut, Rhode Island, Massachusetts, and New York.

Since the maps were donated a stream of graduate students and staff, both at the Thomas J. Dodd Research Center and at MAGIC, have been scanning these maps, georeferencing them and creating a comprehensive index.  The most notable of these graduate students at MAGIC was Dean Chauvin.  Dean wrote a technical article describing the process which was the basis for all future work on this project.  Dean, I know I speak for the graduate students that came after you when I say thank you for your foresight in documenting your efforts in such a clear way! Additionally, if your Python savy, there are some nifty scripts that automate large parts of this process included in the appendices of Dean’s article.

MAGIC has recently released the index for the New York New Haven Hartford Railroad Valuation Maps in the following formats: Google Maps Preview, Google Earth KML file, Shapefiles, and CSV (Figure 1).

Figure 1

Below is a screen capture of the Google Map Preview (Figure 2).  Clicking on the image will take you directly to the interactive map. You can search any place in Connecticut and by clicking on any bounding box the resulting balloon you will give the option to view the digital scan of the original map from the Thomas J. Dodd Research Center.
Figure 2

Currently only Connecticut is available through MAGIC in this specific format.  I know the staff of MAGIC is working tirelessly at getting the remaining state indices online and once they become available we’ll let you know.

Cross- posted to Model Trains & Geography

MAGIC’s GIS Data Distribution Page Has New Look

MAGIC’s GIS Data Page has new Data Categories

MAGIC’s GIS Data Webpage was recently given a makeover! Data is now organized in the following categories:

The downloadable GIS data on MAGIC’s page has been reorganized for better usability.
In addition, the downloadable data has changed. You will find Metadata, Spreadsheet data, Shapefiles, KML’s and a Map Preview option which allows you to preview data in Google Maps. Shapefiles are now conveniently compressed; .zip files now include statewide (or applicable geography-wide) data. Three different shapefiles are included in each compressed file; each with a different coordinate system (Connecticut NAD83 feet, NAD83 meters and WGS84, respectively). 

A Spatial Revolution in the Humanities

Geospatial Technology, particularly in the past decade, has become more intuitive and user-friendly. This, in turn, has catalyzed the growth of a community of users that span a wide range of disciplines. Here, at the University of Connecticut Libraries’ Map and Geographic Information Center (MAGIC), much of what we work on is related to producing or preserving historical spatial data. This includes digitizing and georeferencing historical maps, producing cartographic layers from historical census data and making historical aerial imagery available to the public. We hope that by doing this, we can not only be of service to the traditional users of GIS, but also to those who are breaking new ground and finding novel applications for spatial analysis.

A Viewshed Analysis showing General Robert E. Lee’s perspective on the second day of fighting at Gettysburg. This recent NYT article describes research done at Middlebury College by Geographer Anne Kelly Knowles

The disciplines comprising the humanities, including but not limited to Anthropology, History, and Literature, have recently shown an affinity toward employing spatial analysis techniques. This New York Times article has received much attention lately, as it highlights the use of GIS by scholars to improve their understanding of historical events (such as Gettysburg and The Dust Bowl). A project at the University of Virginia Library, entitled Spatial Humanities, works to encourage this integration of spatial technology in the humanities. In May 2010, the UVA Library hosted an event “The Scholars’ Lab/NEH Institute for Enabling Geospatial Scholarship”. Follow this link to view two minute, three slide Lightning Talks from this event for more examples of spatial humanities projects and works in progress.

Spatially-enabling the humanities is not limited to scholars, however, and Google products have become a great tool for integrating a spatial dynamic for K-12. Google Lit Trips, which is a project that compiles cartographic layers related to Literature, is a great example of this.

At the University of Connecticut, we hope to do our part in contributing to this digitally-enabled spatial revolution in the humanities. Over the past two years, MAGIC has worked closely with Professor Jack Dougherty from Trinity College to produce cartographic products for On The Line: How Schooling, Housing and Civil Rights Shaped Hartford and its Suburbs.

Redlining, or discriminatory lending practices by geographic area, was a driving factor that shaped the Hartford Region. MAGIC helped to produce cartographic layers for On The Line that visually portray these policies.
This web book, supported by a grant from the National Endowment for the Humanities, has been a collaboration between historians, geographers, librarians, technology specialists and students. My colleagues and I at MAGIC have had the opportunity to produce innovative digital maps for this project, some of which have been highlighted in our recent, and ongoing, blog series highlighting our partnership with Jack. In case you missed them, follow these links and stay tuned for more!

UConn Geospatial Coffeehouse – ESRI International User Conference Update

Are you interested in learning about the latest software, web resources, and announcements from the 2011 ESRI International User Conference?  Join us for the first UConn Geospatial Coffeehouse which will feature Jeff Dunn, UConn Department of Geography Graduate Student and contributor to MAGIC’s Outside the Neatline Blog and Very Spatial Blog, who recently attended the 2011 ESRI International User Conference and ESRI Education User Conference in San Diego, CA. Jeff will highlight several key trends, upcoming software, and web resources that are of interest to the geospatial community.

Presentation topics will focus on the following topics to showcase new developments from 2011 ESRI International User Conference:

1. Updates and advances in ArcGIS Desktop and ArcGIS Server 10.1
2. ESRI and Cloud computing 
3. Enhancements and hosted services provided by ESRI’s ArcGIS Online webservice (live demo)
4. ESRI’s Technical Certification Program overview
5. Noteworthy news: Awards given/Presentations/highlights/ new vendor products and services from the exhibition hall
When:
July 28, 2011 from 3:00-4:00pm
Where:
University of Connecticut Homer Babbidge Library Staff Lounge – Plaza Level (see diagram below)
What is the UConn Geospatial Coffeehouse?
The UConn Geospatial Coffeehouse is based on the National Institute for Technology in Liberal Education (NITLE) model for sharing ideas related to geospatial technology and research. The UConn Geospatial Coffeehouse will provide participants with an opportunity to learn about geospatial topics in an informal setting that encourages collaboration and conversations between presenters, researchers, students, and the general public with topics being presented in lightning style format (5 minutes maximum presentation per topic) with group discussions immediately following each topic. 
Live Streaming Attendance Option
Can’t make it to this event, but want to watch from your desk? We are offering a live stream of this event using UStream, a free live streaming service. While the live streaming option is not interactive, it’s a great option to participate from your office, home, or from anywhere with an internet connection. If you are interested in attending this meeting virtually, register using this online form. This event will be broadcast live and will be accessible from the UConn Libraries MAGIC UStream page
Have an idea for a future UConn Geospatial Coffeehouse Topic?
Do you know of a topic and/or speaker that would be a great topic for a future UConn Geospatial Coffeehouse? Feel free to send suggestions for future topics to us at magic@uconn.edu 

This event is sponsored by the University of Connecticut Libraries Map and Geographic Information Center- MAGIC and is free to attend.

Redlining in Hartford area, 1937: A Web-Based Map with Linked Documents

This is the first in a series of posts on web-based maps developed by the University of Connecticut Libraries Map and Geographic Information Center (MAGIC) for the On The Line project.

Today’s web technology can help us to tell more meaningful and visually engaging stories about the past. During the 1930s, a federal agency (the Home Owners’ Loan Corporation, or HOLC) cooperated with private mortgage lenders to assess investment risks across neighborhoods in over 200 U.S. metropolitan regions. These ratings were not based exclusively on the housing stock, but also on racial, ethnic and social class makeup of the residence. These color-coded maps ranked the safest areas for investment in green and the riskiest in red, which in later years became associated with the phrase “redlining,” or discriminatory lending by geographic area. Although some historians have argued that these HOLC maps were not directly implicated in post-war urban decline, they nevertheless reflect the dominant views of the times against racial and ethnic minorities and lower-income families.

HOLC_Image

Caption: Click image to explore our web-based HOLC map for the Hartford area.

At MAGIC, we digitized a 1937 HOLC map of the Hartford area (covering the city, West Hartford, and East Hartford) and created an interactive version using Google Maps API, which can be explored at http://magic.lib.uconn.edu/otl/doclink_holc.html. Click on any color-coded region to view the pop-up bubble, with a link to the original neighborhood appraisal report. For example, see how the HOLC field agent described African-Americans, Jews, Italians, and working-class families as negative factors on home values in several areas.

With support from the National Endowment for the Humanities, MAGIC created this and other interactive maps with Jack Dougherty of Trinity College for the On The Line project. This and other maps are freely accessible in a public history web-book, titled On The Line: How Schooling, Housing, and Civil Rights Shaped Hartford and its Suburbs, which tells the story of schooling and housing boundary lines that have divided metropolitan Hartford, Connecticut over the past century, as well as the struggles of ordinary families and civil rights activists who have sought to cross over, redraw, or erase these lines. See other examples of web-based HOLC maps for other cities, such as “Redlining in Philadelphia” (by Amy Hillier), “Mapping Decline: St. Louis and the American City” (by Colin Gordon), “Redlining Richmond” (by Robert K. Nelson), and “T-RACES: Testbed for the Redlining Archive of California’s Exclusionary Spaces” (by Richard Marciano et al.), which also appears in the Los Angeles section of HyperCities.

Technical detail:

This document-linked dual-view map was created through a multistep process. First, Jack Dougherty scanned the 1937 paper map and neighborhood appraisal reports at the National Archives II in College Park, Maryland. Next, MAGIC staff georectified, “heads-up” digitized, and attributed the map into polygons using ArcMap. After creating the shapefile, the symbologies were selected based on the historical map color scheme and converted to a KML file using the ArcToolbox conversion tool.

The mashup was created using Google Maps Javascript API version 3, which allows the KML file to be layered on top of a Google Map. We enhanced the standard mashup by adding a custom search box to locate any address on the map, and customized JavaScript to link controls for zoom and pan for the dual views. The HTML code for the pop-up windows, which links each of the KML areas to a specific PDF document, can be created in Google Earth. All of our web-based maps use open-source code to the maximum extent feasible, and we encourage users to borrow freely and create their own versions. In the near future, a detailed write-up will be provided on the MAGIC website detailing how the interactive web-based maps were created.

Coming next in this series — Neighborhood Change, 1934-Present: A Dual View Map with Linked Controls

What’s New at MAGIC – Summer 2011

Over the past two years, the University of Connecticut Libraries Map and Geographic Information Center – MAGIC has embarked on a number of changes to increase access to data and maps from our collections via our website. Each of these changes have been driven by our users as MAGIC transforms to meet the every changing needs of our users. Using the University of Connecticut’s Academic Plan, the University Libraries Strategic Plan, the Horizon Report, and user feedback for guidance in our effort to improve the overall user experience, several significant changes have taken place which have resulted in increased usage and have fostered new collaborations across the region. Thanks to the efforts to enhance and improve MAGIC’s web presence we have seen a dramatic increase in the number of web users from 51,789 in 2008 to over 460,000 in 2010. Included below are just a few examples of the number of enhancements to the MAGIC website:

Infrastructure for the Future

The past few years the University of Connecticut Libraries have invested heavily in infrastructure to help MAGIC meet the needs of our users. Thanks to the efforts of the Libraries IT Services staff, MAGIC has been able to transition for a 6+ year old web server which included both website content and data to a new server infrastructure that includes MAGIC’s web content while also providing users with downloadable datasets, maps, and aerial photography directly from our recently developed digital archive. The MAGIC digital archive, is a web server that contains all of the full-quality original imagery, maps and data products developed by MAGIC and our collaborators, that is backed up on a regular basis (Hourly) and provides a permanent home for digital content from MAGIC. This new infrastructure has expanded MAGIC’s offerings to enable users to access the highest-quality imagery and maps 24 hours a day, thus enabling users to have unprecedented access to maps and aerial photography images, something that no other academic map collection is able to match!

During this infrastructure migration process, each step has focused on the sustainability of our resources, and as a result some resources that were formerly offered by MAGIC will no longer be available. With a focus on the future, one that includes a variety of operating systems and devices, products that were based on Perl programming (MAGIC’s former data pages by quadrangle, town, and county and other Perl based pages) are being replaced by statewide data offerings available from MAGIC’s GIS Data download page (http://magic.lib.uconn.edu/connecticut_data.html). This migration from Perl based pages is essential for the long-term success of MAGIC as we no longer have programmers available that are proficient in Perl. This change has also enabled us to streamline data offerings and enables us to generate data previews, KML (Google Earth friendly files), and multiple projections for each shapefile to meet the diverse need of our users. This migration was necessary in preparation for migration to an ArcSDE Server (a behind the scenes data management program to manage the 5 Terabytes (and growing) of data available from MAGIC). Over the next year we will also be developing and testing a series of services using the ArcGIS Server platform to enable users to view data and maps via mobile devices.

Collections

The MAGIC Historical Map collection includes the ability to download TIFF versions of each map (georeferenced when possible) directly from our website. The Historical Map Collection at MAGIC is also included on MAGIC’s Flickr site (a popular image and photo sharing site) which enables more users to discover our resources as the maps are readily searchable via a Google Images search and via numerous search engines. This has resulted in a dramatic increase in the use of our Historical Maps (130,913 views of MAGIC’s Flickr maps in 2010).

With an increasingly diverse user population, MAGIC has been utilizing Google Analytics to identify trends in usage of our web content. As an example, keyword searches conducted on MAGIC’s website are analyzed to determine if there are emerging trends/topics and we then use this data to focus our data creation and digitization efforts. This data has been critical to our recent success with obtaining a grant from the National Endowment for the Humanities to co-develop a web book with Trinity College that integrates interactive maps from MAGIC with content (see http://ontheline.trincoll.edu).

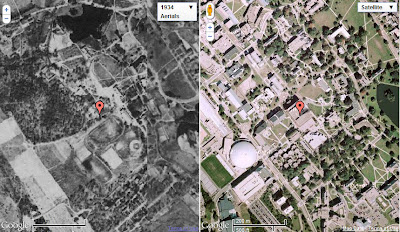
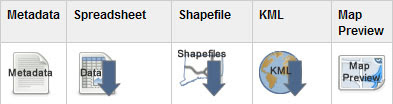
To further promote access to MAGIC’s historical aerial photography collection, the aerial photography indexes have been updated to include links to PDF and TIFF images (more coming soon) and these indexes are available in spreadsheet, shapefile, KML, and Map Preview options (see http://magic.lib.uconn.edu/connecticut_data.html#indexes). We are also in the process of creating aerial photography mosaics for the Hartford Region at 20 year increments (when possible) and once these are complete, we will be adding these to MAGIC. In the coming weeks we will also be adding 30+ years of Connecticut coastal infrared aerial photography to this site which will include PDF and TIFF images thanks to a two year collaborative grant project with the Connecticut Department of Environmental Protection.

Mash-ups and KMLs


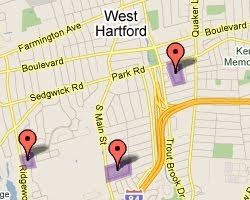
Making data and maps more user friendly is a key focus of MAGIC’s efforts and because of this need we have created customized Google Map Mash-ups (maps that blend data from multiple sources) for multiple topics. Each of MAGIC’s map mash-ups utilize the Google Maps API to create these custom interfaces and a complete listing of our latest map mash-ups are available on MAGIC’s website at: http://magic.lib.uconn.edu/mash_up/

We have also expanded our data pages to include KML (Google Earth) files when possible as more of our users are turning to Google Maps and Google Earth as there map creation tools. There are numerous classroom applications for using Google Maps and Google Earth and we are happy to work with anyone interested in exploring options for visualizing data for their classes using these tools.

GeoCommons at MAGIC

Over the past year, the former Map Reading Room on Level 4 of the Homer Babbidge Library has been transformed into a collaborative learning environment with the addition of new reconfigurable furniture, 2-46 LCD screens to enable group collaborations with laptops, and a desktop computer with ArcGIS, Adobe Creative Suite, Video Editing, Google Earth and more is also available for public use anytime the Homer Babbidge Library is open. We encourage you to stop by and see this new space!

Internships at MAGIC

Through a collaboration with the Department of Geography, MAGIC offers an internship program for undergraduate students majoring in geography. This internship program allows students to further develop their skills with geospatial data and maps through a hands-on immersive experience at MAGIC that includes digitizing data and maps, developing interactive maps, and more. Special thanks to Dr. Osleeb, Dr. Berentsen, Dr. Cromley, and Dr. Seth for promoting this internship program.

Forthcoming Updates:

Over the next year several updates will be made to provide new services and resources via MAGIC’s website. Included below are some of the projects underway now that will further expand upon our web offerings:

Connecticut GIS Data Page is being updated to include more KML and Google Map Preview options as well as bundling all our shapefiles for each dataset into one zipped file so users can download NAD 83 and WGS versions of the data as one package. This bundling of the data enables users to create print maps in Connecticut State Plane projections while also providing the shapefile in WGS1984 projection to enable users to quickly generate KML data using ArcGIS and other mapping programs.

Historical Maps Collection will expand to include more maps, each with TIFF versions available.

Develop and Test a series of map services using ArcGIS Server 10 to provide more options for viewing aerial imagery, historical maps, and data provided by MAGIC. This server will also enable data and maps from MAGIC to be viewable via the ArcGIS mobile application for iPad, iPhone, Android, and Blackberry devices.

Developing Map Mash-ups that utilize additional data and maps from MAGIC’s collections.

Exploring options for enabling users to provide comments on MAGIC’s maps and resources.

Expand KML offerings to enable users to view more of MAGIC’s data and maps via Google Earth, Google Maps, and Google Fusion Tables.

This is just a few of the exciting things happening at MAGIC. To keep current on the latest events at MAGIC follow our blog, Outside the Neatline, or you can follow us on Twitter, Facebook, and via RSS. Check out our website at: http://magic.lib.uconn.edu

We would also like to recognize the faculty, students and the UConn Libraries IT staff that have assisted us at MAGIC over the past few years to enable us to transform from a map library into a Map and Geographic Information Center. Thanks to their efforts, MAGIC has been recognized by EDUCAUSE, NITLE, NEH, and several of national and regional organizations.

May 3-4, 2011 – GIS & Public Health Conference

Registration is now open for the 7th Annual GIS & Public Health Day to be held at the University at Albany School of Public Health in Rensselaer, NY on May 3, 2011. The theme of the conference is “GIS and Community Health Planning” and this year’s keynote presentation “All Public Health is Local: The Community Perspective on GIS and Public Health” is to be given by Dr. Russell Kirby from the University of South Florida.

Registration and additional details on this event are available at: http://www.albany.edu/sph/cphce/gis_2011.shtml

Participants can also register for training day sessions to be held on May 4, 2011 at the University at Albany School of Public Health in Rensselaer, NY

If you have any questions about the conference, they can be sent to the School of Public Health Center for Public Health Continuing Education at: coned@albany.edu

MAGIC Server Outage – 3/18/2011 at 4:00am

The University of Connecticut Libraries Map and Geographic Information Center – MAGIC server will be updated on March 18, 2011 from 4:00am – 7:00am in order to replace a failing drive. During this outage the Map and Geographic Information Center – MAGIC website will be unavailable. During this outage users can access some content included on MAGIC’s website from the following sources:

– Aerial Photography for Connecticut from CT ECO
– MAGIC’s Historical Maps Collection via Flickr
– Census Boundary files and Data for Connecticut from the Connecticut State Data Center
– GIS shapefiles for Connecticut from the Connecticut Department for Environmental Protection.

We apologize for any inconvenience this outage may cause our users and have scheduled this outage at a time that will impact the least amount of our users. We anticipate our website to be online by 8:00am on Friday March 18, 2011.

2010 Connecticut Census Data – Quick Facts

On Wednesday March 9, 2011 at 2:00pm the U.S. Census Bureau released the Connecticut redistricting data. This dataset includes total population, race, ethnicity, voting age (18+), and housing occupancy data for multiple geographies in Connecticut. To allow for quick comparisons between 2000 and 2010, the Connecticut State Data Center has created a dual map viewer which enables users to search for a town, click on the town, and view data from 2000 and 2010 side by side. Check out this Connecticut census data viewer!
Included below is a summary of quick facts from this 2010 Census data release for towns in Connecticut based on population increases and decreases from 2000 to 2010:

Connecticut Towns with Largest Increases in Population from 2000 to 2010

Town 2010 Population
1 New Haven, CT 6,153
2 Danbury, CT 6,045
3 Mansfield, CT 5,823
4 Stamford, CT 5,560
5 Bridgeport, CT 4,700
6 Middletown, CT 4,481
7 Norwich, CT 4,376
8 Hamden, CT 4,047
9 Manchester, CT 3,501
10 Southington, CT 3,341


Connecticut Towns with Population Decreases from 2000 to 2010

Town 2010 Population
1 Branford, CT 28,026 (-657)
2 Enfield, CT 44,654 (-558)
3 East Hampton, CT 12,959 (-393)
4 West Hartford, CT 63,268 (-321)
5 Sherman, CT 3,581 (-246)
6 Salisbury, CT 3,741 (-236)
7 Sharon, CT 2,782 (-186)
8 Old Saybrook, CT 10,242 (-125)
9 Bridgewater, CT 1,727 (-97)
10 New Fairfield, CT 13,881 (-72)

More details will be made available soon! Be sure to check out the newly redesigned Connecticut State Data Center website for 2010 Census data and shapefiles.