Congratulations Dr. Weixing Zhang

Quote

Over the past five years, if you have contacted the UConn Library MAGIC and/or the Connecticut State Data Center either virtually or in person, you have likely had an opportunity to interact with our graduate assistant Weixing Zhang. At the end of Spring 2018, Weixing Zhang graduated with his PhD in Geography from the University of Connecticut!
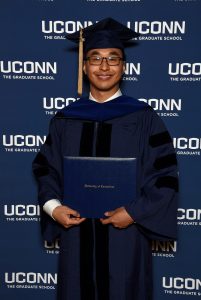
 

Weixing_Zhang_graduation_2018

Dr. Weixing Zhang

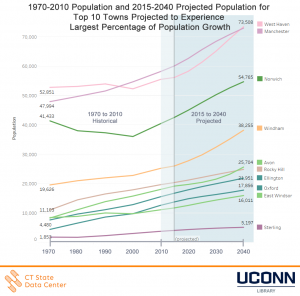
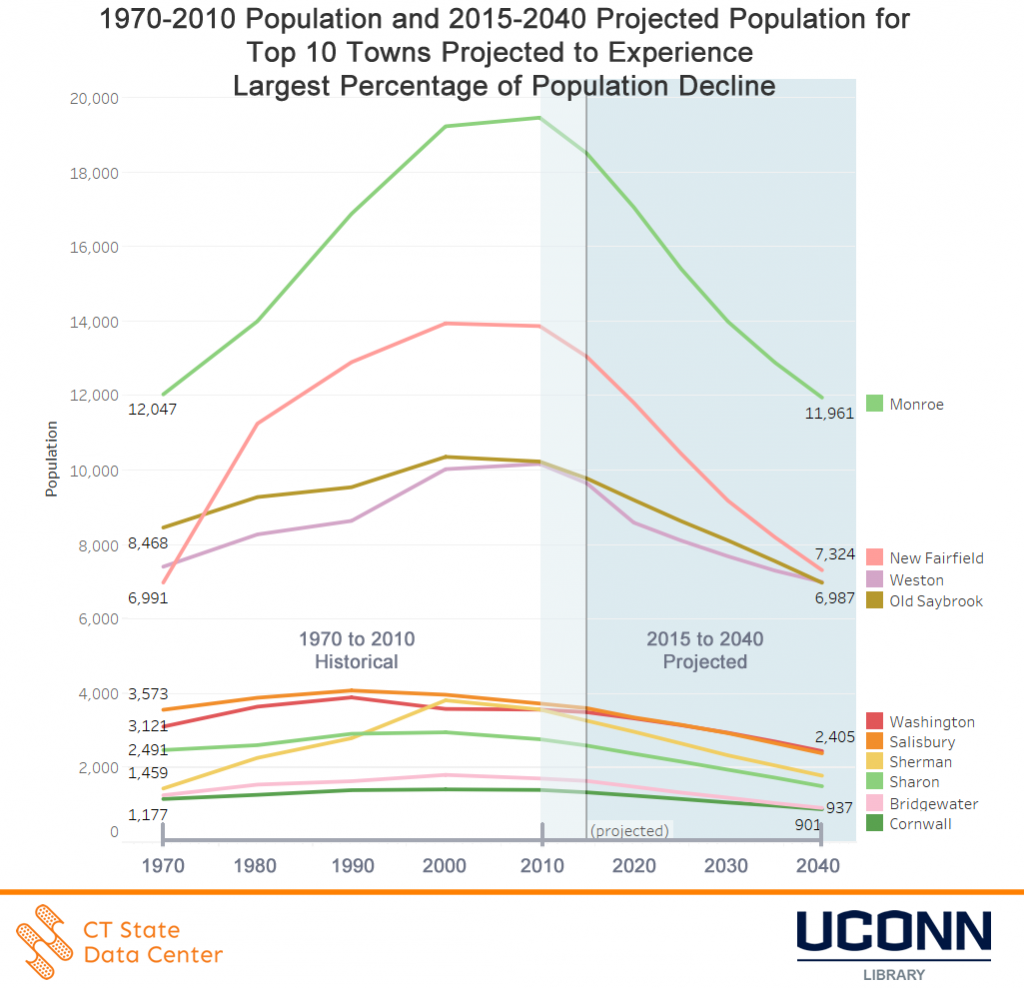
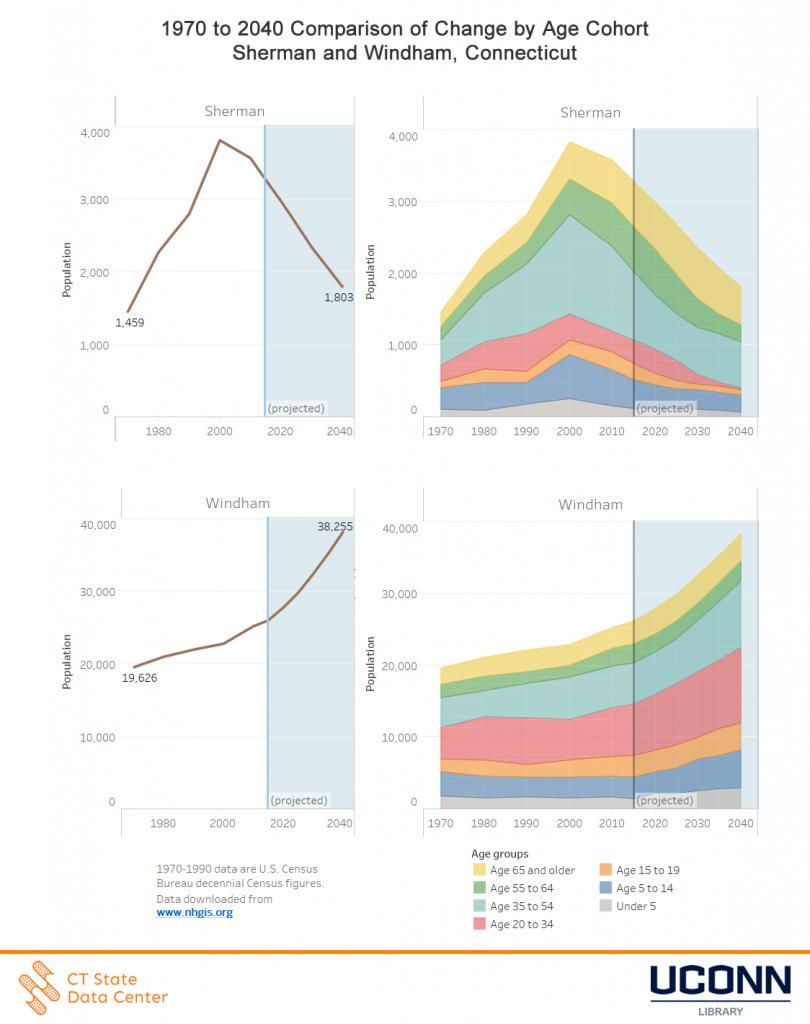
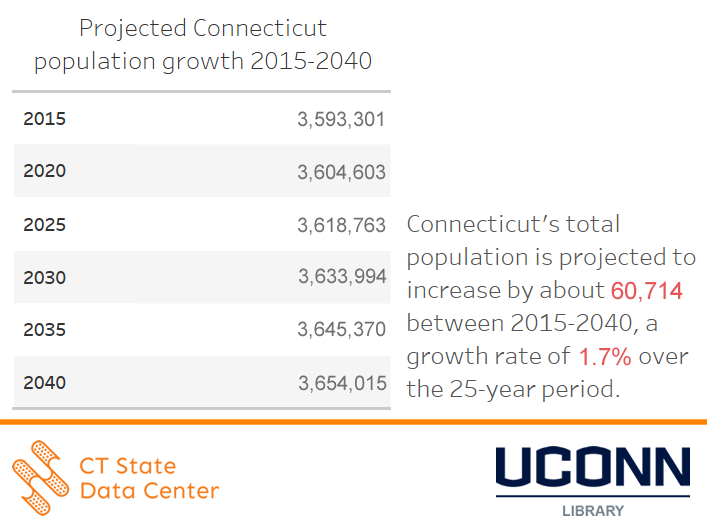
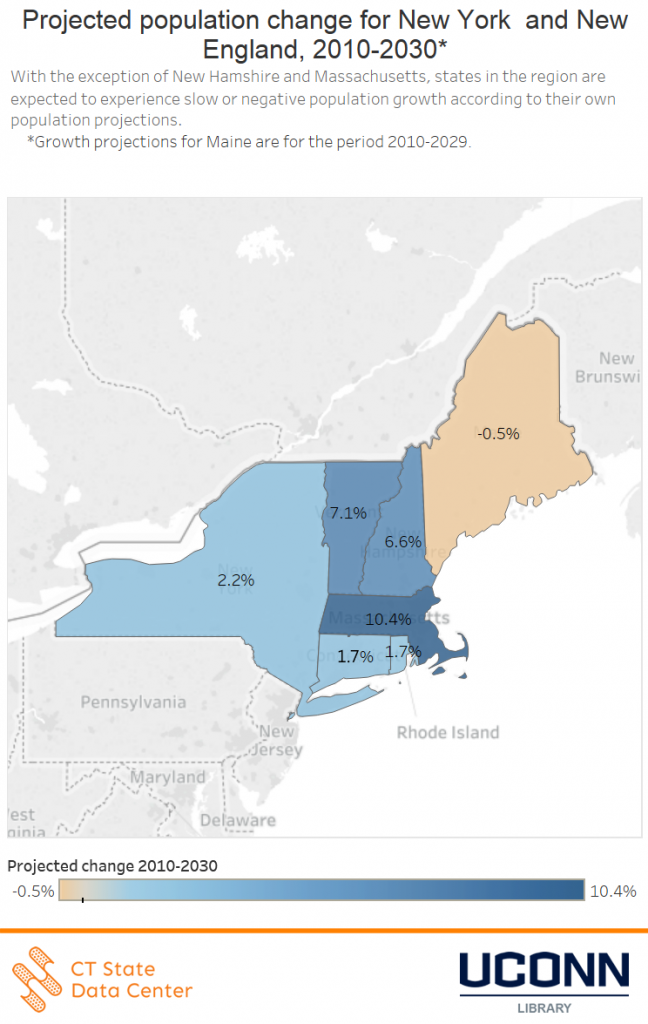
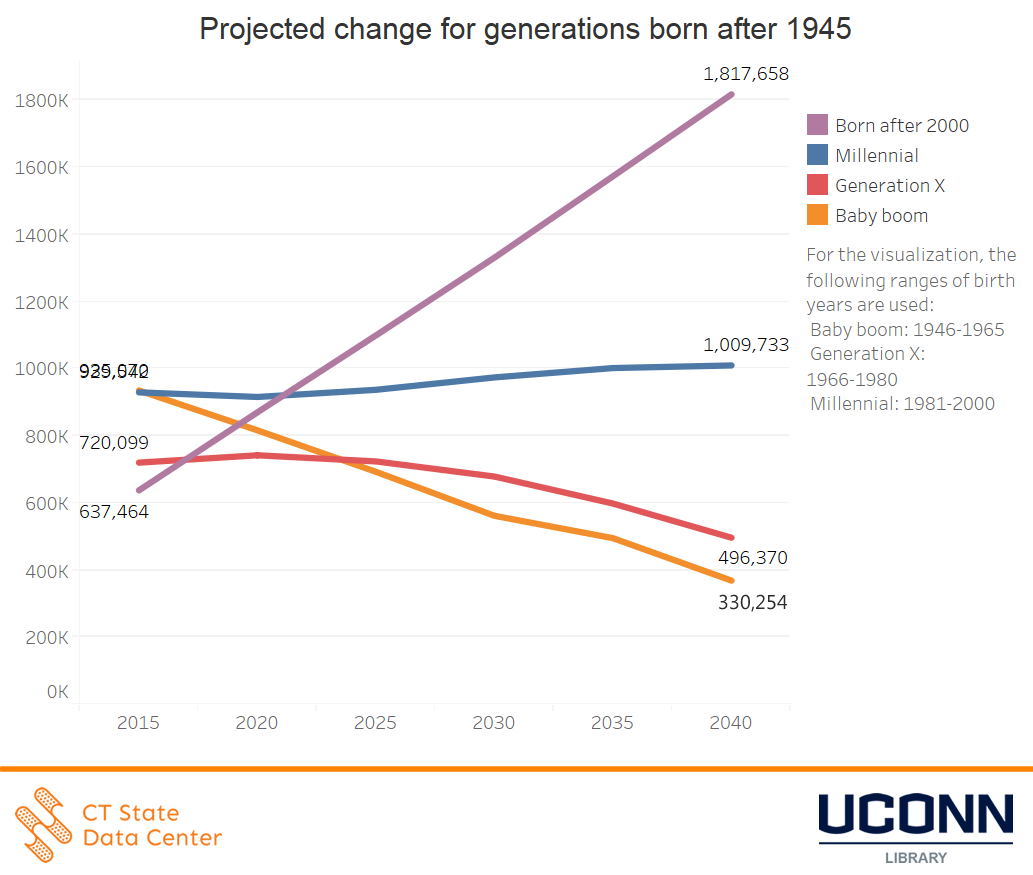
During Weixing’s tenure at both the UConn Library MAGIC and the Connecticut State Data Center, he has assisted users on a number of data requests, developed custom maps, developed scripts to process and visualize data, and contributed or led a number of projects and initiatives. One of the largest and most in-depth projects Weixing helped make a reality was developing the 2017-2018 release of the 2015 to 2040 Population Projections for the State of Connecticut, a project which involved over 2.5 years of research, analysis, and working with multiple collaborators before the final projections could be developed and published to the Connecticut State Data Center and Connecticut Open Data websites.


Prior to his last day at the UConn Library MAGIC and the Connecticut State Data Center we asked Weixing about his experiences these past five years and he shared the following:

“I would like to highlight how MAGIC gave me opportunities to collaborate with individuals, agencies, and organizations throughout the region so that I could have a better understanding of the value of maps, census data, and geospatial technologies in society. I am sure that these skills and connections I have made while at MAGIC will benefit me tremendously in my future career.”

– Dr. Weixing Zhang


Dr. Weixing Zhang is one of a series of graduate assistants and undergraduate interns which the UConn Library MAGIC and/or the Connecticut State Data Center has had the opportunity to work with to develop resources and provide assistance to our users. We are especially appreciative of the Office of Policy and Management, UConn Department of Geography, and the UConn Library for making these graduate assistantships and internships possible.


Thank you Dr. Weixing Zhang for all your hard work, dedication, and collaborative initiatives you contributed to at the UConn Library MAGIC and the Connecticut State Data Center and we wish you well and best of luck on your new adventures post graduation!

New ACS data on county-level income inequality

According to the latest American Community Survey (ACS) data released today by the Census Bureau, more than half of Americans live in counties that experienced a statistically significant increase in income inequality between the 2007-11 and 2012-16 ACS survey periods. The latest 2012-16 ACS 5-Year Estimates dataset indicates that inequality has increased significantly in almost a quarter of U.S. counties since the 2007-11 ACS 5-Year Estimates survey period. There was a statistically significant increase in inequality in 742 counties, a decrease in inequality in 86 counties, and no statistically significant change in the other 2,312 counties.

American Community Survey 5-Year Estimates datasets include demographic and economic statistics for all geographic entities, including counties with relatively small populations; as the ACS is a sample survey, estimates for these area tend to have higher corresponding margins of error. This visualization utilizes a calculation to take into account the sampling error associated with each estimate of county-level income inequality, to determine if differences in measured inequality between the two survey periods are statistically significant. Click any county in the map below to see a link to the original American Community Survey data for the county, through the American FactFinder data portal.

Open Data in Action – October 26, 2017 at Hartford Public Library

Open Data In Action brings together a wide range of researchers to showcase how their work has benefited from openly and freely accessible data. Presenters from the public, private, and academic sectors will discuss how open data, ranging from historical documents to statistical analyses, is being used to create projects, change policies, or conduct research and highlight the importance open data has on shaping the world around us.

This event will feature a number of open data focused researchers and open data providers and is open to the public.
When: Thursday, October 26, 11:00am-2:00pm

Where: Hartford Public Library, Atrium 500 Main Street, Hartford, CT

Who can participate: Free and open to the public

Cost: Free
Opening Remarks:

Tyler Kleykamp, Chief Data Officer, State of Connecticut


Presenters:

Rachel Leventhal-Weiner, CT Data Collaborative, CT Data Academy

Jennifer Snow, UConn Library, Puerto Rico Citizenship Archives: Government Documents as Open Data

Tina Panik, Avon Public Library, World War II Newsletters from the CTDA

Rebecca Sterns, Korey Stringer Institute, Athlete Sudden Death Registry

Andrew Wolf, UConn Digital Media & Design, Omeka Everywhere

Steve Batt, UConn Library /Connecticut State Data Center, Tableau Public and CT Census Data

Anna Lindemann/Graham Stinnett, UConn/DM&D, & Archives, Teaching Motion
Graphics with Human Rights Archives

Thomas Long, UConn Nursing, Dolan Collection Nursing History Blog

Jason Cory Brunson, UConn Health Center, Modeling Incidence and Severity of Disease using Administrative Healthcare Data

Brett Flodine, GIS Project Leader, City of Hartford Open Data

Stephen Busemeyer, The Hartford Courant, Journalism and the Freedom of Information

Open_Data_Sponsors


Connecticut’s Towns Experiencing a Demographic Shift from 2015 to 2040, Connecticut State Data Center Reports

August 31, 2017 – Towns in Connecticut are projected to slowly gain population as a total, according to the 2015 to 2040 population projections for all 169 towns in the state of Connecticut, released today by the Connecticut State Data Center.

2015_2040_town_projected_growth

1970-2010 Population and 2015-2040 Projected Population for Top 10 Towns Projected to Experience Largest Percentage of Population Growth

The new projections show that multiple towns are approaching a demographic shift due to an aging population, a near net zero overall migration rate, and a relatively low, but stable, birth rate.  Windham, East Windsor, Avon, Oxford, Ellington, Sterling, Norwich, West Haven, Rocky Hill, and Manchester are expected to experience the largest percentage of increase in overall population projected from 2015 to 2040.

2015_2040_town_projected_decline

1970-2010 Population and 2015-2040 Projected Population for Top 10 Towns Projected to Experience Largest Percentage of Population Decline

The towns of Sherman, New Fairfield, Bridgewater, Sharon, Monroe, Cornwall, Salisbury, Old Saybrook, Washington, and Weston are projected to experience the largest percentage of decline in the overall population from 2015 to 2040.

The changing demographics by age cohort for towns in Connecticut provides a more complete picture of the overall trends within towns over time.  The Connecticut State Data Center has released an interactive data dashboard to accompany the release which enables users to view demographic changes town by town with data from 1970 to 2040.  When reviewing the age cohort data, long-term trends in demographics shifts within towns, and more broadly across the state when comparing multiple towns, indicate which towns are experiencing stable or declining births by examining the under 5 age cohort, as well as visually presenting the demographic shift between age cohorts as individuals age 55 to 64 age into the 65+ age cohort.


The comparison between are largest percentage of population gain (Windham) versus our largest percentage of population decline (Sherman) highlights the shifts in age cohorts within these towns.

1970_2040_age_cohort_change_Sherman_Windham

1970 to 2040 Comparison of Change by Age Cohort for Sherman and Windham, Connecticut


Connecticut’s eight most populous towns will see a growing or stable population based on the projections from 2015 to 2040, following an overall trend for several of these towns since 2000.

Overview, Connecticut will grow slowly in population from 2015 to 2040. The projected populations for each town can differ over time based on factors not included within the projections model, and thus these population projections are reviewed annually by the Connecticut State Data Center and compared to the most recent data to adjust projections if data reflects changes in the projected trend for a town. For more details on the data release and how to view and access data, visit the Connecticut State Data Center 2015 to 2040 Town Population Projections site.

Connecticut State Data Center Embargo Release of 2015-2040 Population Projections for the State of Connecticut Towns

August 15, 2017 – The Connecticut State Data Center will release the 2017 edition of the state of Connecticut Town Population Projections for 2015 to 2040 on August, 31, 2017.  This release will include population projections by five year age cohorts and sex for each of the 169 towns in the State of Connecticut.  This release only includes town population projection with other geographies for Connecticut to be released in upcoming releases.  Prior to the public release of the town population projections for 2015 to 2040, the Connecticut State Data Center will offer embargo access to the media and to Connecticut focused data organizations in advance of the public release.

When: Tuesday, August 29, 2017 at 10 a.m. EDT to Thursday August 31, 2017 at 12:01 a.m. EDT.

Where: Connecticut State Data Center embargo site.

Interview requests: Embargo subscribers may interview Connecticut State Data Center staff during the embargo period.  To request an interview, email ctsdc@uconn.edu.

Obtain media and Connecticut focused data organizations embargo access: Visit the Connecticut State Data Center’s embargo website for access.

Embargoed summary documents, press release templates, data visualizations, and raw data may not be released to the public by any means (including print, broadcast, Internet, podcast, social media, blogs, or in any other form) prior to public release.  The public release will be at 12:01 a.m. EDT, Thursday August 31, 2017.

For more details on the embargo and how to request embargo access, visit the Connecticut State Data Center Embargo site.

Connecticut’s Population is Expected to Grow Slowly, Connecticut State Data Center Reports

For Immediate Release: Monday July 31, 2017
(Revised September 19, 2017)

Connecticut’s Population is Expected to Grow Slowly, Connecticut State Data  Center Reports


July 31, 2017 –  The state of Connecticut is expected to add about 60,700 residents from 2015 to 2040, according to the 2015 to 20140 population projections for the state of Connecticut, released today by the Connecticut State Data Center.


The new projections, based on the age characteristics of the states population along with recent birth, death, and migration rates, indicate that the states resident population is expected to grow from about 3.59 million in 2015 to approximately 3.65 million in 2040, a 1.7% growth rate over the 25-year period.
projected_Connecticut_population_growth_2015_2040_table

Figure 1: 2015 to 2040 Population Projections for the State of Connecticut

The slow projected growth mirrors that of states in the region, with most states in New England predicting small gains in population, or even negative growth, in the foreseeable future.


From 2010 to 2030, Connecticut is projected to gain 1.7%, Maine is projected to lose 0.5%, Massachusetts is projected to gain 10.4%, New Hampshire is projected to gain 6.6%, New York is projected to gain 2.2%, Rhode Island is projected to gain 1.7%, and Vermont is projected to gain 7.1% in population, according to projections produced by each of the respective states.

regional_population_changes_for_New_York_and_New-England_2010_2030

Figure 2: Projected Population Change for New York and New England, 2010 – 2030*


A main factor driving low projected growth are regional trends in fertility rates, the number of births per 1,000 women of childbearing age. New England states fertility rates trailed those of all other states in 2015, according to the latest data from U.S. Health and Human Services. Connecticut’s fertility rate of 52.5 was the 5th lowest in the country, slightly greater than rates in Rhode Island, Massachusetts, New Hampshire and Vermont, which ranked last.


As the baby boomer generation ages, a generational shift is projected to occur in Connecticut as the Millennials (individuals born 1981-2000) remain a nearly stable population in Connecticut while the population born after 2000 is projected to continue to rise from 637,000+ in 2015 to a projected 1.8 million by 2040.

projected_change_for_generations_born_after_1945_ct_projections_2015_2040

Figure 3: Projected Change for Generations Born after 1945


“Land of steady habits” summarizes the overall recent trends of birth, mortality, and migration rates, trends which are held constant in the projection models. Migration – both domestic and international – also contributes to changes in Connecticut’s projected population.  With recent years seeing Connecticut’s population change nearing a net zero, when compared to birth, mortality, and international migration, it is important to look at the entire picture of data to see that Connecticut continues to experience growth.

With a projected 1.7% growth rate projected from 2015 to 2040, this rate can be influenced by a number of factors ranging from changes in domestic and international policy related to migration, to changes in fertility rates.


Figure 3: Projected Change in Population for Generations Born After 1945

The population projections included in this release are based solely on demographic trends, and do not attempt to predict or account for future changes in economic, employment, or housing factors in the state.
For more details on the data release and how to view and access data, visit the Connecticut State Data Center 2015 to 2040 Population Projections site.

Note: This Press Release was updated on September 19, 2017 to correct an error in the data that was published on July 31, 2017.

Connecticut State Data Center Embargo Release of 2015-2040 Population Projections for the State of Connecticut

July 25, 2017 – The Connecticut State Data Center will release the 2017 edition of the state of Connecticut Population Projections for 2015 to 2040 on July, 31, 2017.  This release will include population projections by five year age cohorts and sex for the State of Connecticut.  This release only includes state population projection with other geographies for Connecticut to be released in upcoming releases.  Prior to the public release of the state population projections for 2015 to 2040, the Connecticut State Data Center will offer embargo access to the media and to Connecticut focused data organizations in advance of the public release.

When: Friday, July 28, 2017 at 10 a.m. EDT to Monday July 31, 2017 at 12:01 a.m. EDT.

Where: Connecticut State Data Center embargo site.

Interview requests: Embargo subscribers may interview Connecticut State Data Center staff during the embargo period.  To request an interview, email ctsdc@uconn.edu.

Obtain media and Connecticut focused data organizations embargo access: Visit the Connecticut State Data Center’s embargo website for access.

Embargoed summary documents, press release templates, data visualizations, and raw data may not be released to the public by any means (including print, broadcast, Internet, podcast, social media, blogs, or in any other form) prior to public release.  The public release will be at 12:01 a.m. EDT, Monday July 31, 2017.

For more details on the embargo and how to request embargo access, visit the Connecticut State Data Center Embargo site.

Census Tracts with median household income less than 60% of state average

The visualization below highlights Census Tracts with median household income less than sixty percent of statewide averages, according to American Community Survey data.

Data source: U.S. Census Bureau American Community Survey 5-Year Estimates, table B19013

Housing Units Source of Heat in Connecticut

How does Connecticut heat up their homes during the cold seasons? There are numerous ways to provide heat for a home. This visualization shows the different types of heat sources and how many housing units use them for each Connecticut town. You can see trends in the data when looking at the maps. Towns with urban environments tend to use utility gas and kerosene as a source of heat. Rural and suburban towns tend to use liquefied petroleum gas or wood as heating sources. Surprising data I found is that some homes use solar energy for heat. There is not a lot of homes that use solar energy, but maybe the number will increase in the future as we adapt to more renewable energy. The data source is from the American Community Survey 5-year estimate from 2011 to 2015. This data visualization is for the 2015 year.


https://public.tableau.com/views/HeatingSourceMapsandFiguresFeb2/Story1?:embed=y&:display_count=yes

Demographics of Oglala Lakota County

The Keystone Pipeline is an oil pipeline running from the Canadian Tar Sands in Alberta to the Gulf Coast in Texas. The plan for the fourth phase of this project proposes to run a new section of this pipeline under the Missouri River, just upstream of the Oglala Lakota sacred land. The Lakota people rely on this river for their livelihood. In the wake of the Flint, Michigan crisis, the main concern of locals is possible contamination of the water. The implications would be catastrophic leading to the inability to use the river to fish, irrigate crop land or even have clean water to drink.

This map visualizes 2 sets of data obtained from the US Census Bureau on family income and minority populations. The 2 maps show striking similarities. Upon some calculations and research into the maps it was quite apparent that the Oglala Lakota County had the highest percent minority population of any county in the entire United States. Oglala Lakota County also has the 3rd lowest mean family income in the country. It is one of three counties in the United States completely encompassed by a Native American reservation. The Lakota tribe considers the Missouri River sacred since it has been the tribes main source of life since they inhabited the land nearly 1200 years ago.

-Cody J. Crane

UConn MAGIC 2017