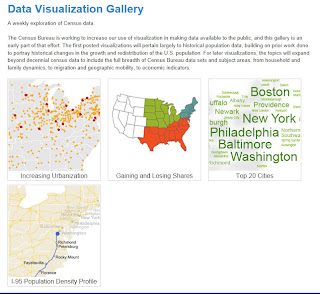
Each week the U.S. Census Bureau is featuring a new data visualization on the census.gov website. These visualizations will highlight various datasets and variables provided by the U.S. Census Bureau with a new visualization posted each week.
Explore visualizations on the following:
- Increasing Urbanization
- Gaining and Losing Shares
- Top 20 Cities
- I-95 Population Density Profile
- and more are added each week!
Explore the most recent data visualizations from the U.S. Census Bureau at: http://www.census.gov/dataviz/

