About the Projections
The Connecticut State Data Center at the University of Connecticut Libraries Map and Geographic Information Center (MAGIC) has just released updated population projections for Connecticut based on the 2010 Census data. The population projections include state, county, regional planning organization, and town level population projections for 2015, 2020, and 2025 and include population totals, age groups, and age groups by sex projections. The projections were developed through a collaboration between the Connecticut State Data Center, the Office of Policy and Management, the Connecticut Department of Public Health, and the Department of Geography at the University of Connecticut.
Population projections are essential for planning, analysis, and informed decision making and these updated projections provide users with three scenarios for population change for 2015, 2020, and 2025 to highlight potential changes in the population based on increases/decreases in the fertility rates within a geographic location. The Connecticut State Data Center has included three fertility rates (high, medium, and low) for each year to provide users with a range of potential population changes and these three rates highlight that population projections are estimates which are subject to change based on a number of factors. Included below are brief definitions of each fertility rate included in these projections.
High Fertility Rate: This scenario assumes a high rate of population growth which based on recent trends in Connecticut’s population is least likely to occur. The High Fertility rate scenario serves as a guide of what could happen if the selected geography experienced a baby boom type scenario
Medium Fertility Rate: This scenario assumes a medium rate of population growth.This scenario would be most likely for areas experiencing moderate growth.
Low Fertility Rate: This scenario assumes a low rate of population growth. This scenario would be most likely for areas with slow population growth.
Exploring the 2015-2025 CtSDC Population Projections
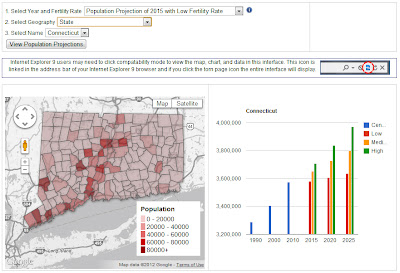
The 2015-2025 Population Projections are available via the interactive data viewer developed by the Connecticut State Data Center. This viewer allows users to select a year and fertility rate, select the geography (State, County, Regional Planning Organization, and Town), and select the place you want to view projections data. The Viewer includes an interactive map, an interactive chart, and an interactive table of data which is sortable. In the coming weeks, users will be able to download this data in spreadsheet and shapefile formats.
View the 2015-2025 Population Projections for Connecticut at: http://ctsdc.uconn.edu/projections.html

