
Voting Report: State-Level Maps and Graphs on Voting
Check out the Voting Patterns by State
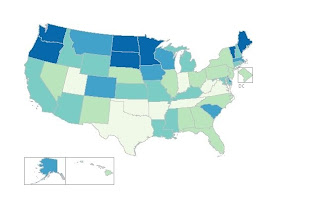
The Census Bureau has released a menu-driven, interactive Web page permitting users to access for any state a series of graphs showing percentages of adults who voted and registered in every congressional and presidential election between 1996 and 2010. In addition to graphs showing voting and registration trends over the period, users may choose a given election year and find separate graphs showing voting and registration by one of the following characteristics: age, sex, educational attainment, and race and Hispanic origin. Some analysis of the 2010 election is provided as well, as are thematic maps of states showing percent voting during each election. The statistics come from the Current Population Survey.
View additional information at the US Census Bureau Voting Registration Voting Hot Report