The Atlas of Economic Complexity: Mapping Paths to Prosperity is a fascinating look at the global economy. The Center for International Development at Harvard University, The Harvard Kennedy School, and Macro Connections at MIT have collaborated to create a project that includes both a detailed report and a dynamic set of interactive visualizations regarding countries’ varying economic complexity. The report includes an economic complexity index ranking in which Japan ranks first (the US is ranked 13th).
The aforementioned visualizations can be created at The Observatory of Economic Complexity, which allows you to generate a number of different economic charts and maps. For example, you can choose to show imports or exports, different products, and years. In addition, you can view charts as animations (from the years 1962-2009). Below are a few examples of these with the focus being on beer imports in the United States:
 |
| A map of beer imports around the world. |
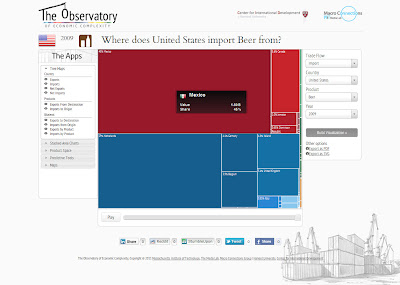 |
| A Tree Map of beer imported to the United States. |
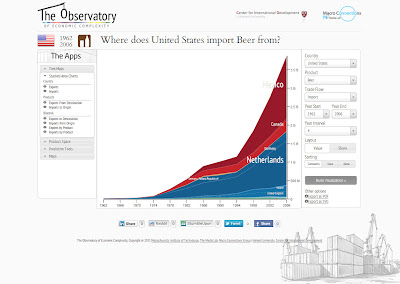 |
| A Stacked Area Chart of beer imported to the United States. |


