
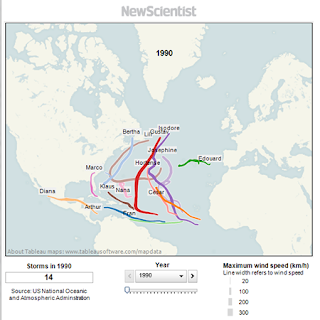
With hurricane season upon us, the New Scientist has developed a visualization of the path of hurricanes for the past 20 years. Explore year by year the path of each hurricane, view the total number of storms for each year, and each visualization includes the maximum wind speed for each storm.
As you explore this article further you will discover that 2005, the same year that Katrina and Rita caused so much damage to the gulf coast, there were a total of 28 storms. These 28 storms in 2005 resulted in just over 1,000 casualties, representing the highest number of hurricane related deaths over this 20 year period.
Review this article and view 1990-2010 Hurricane Visualizations at:
http://www.newscientist.com/blogs/shortsharpscience/2011/05/prepare-for-hurricane-season.html
 Want To Explore More Hurricane Data?
The National Oceanic and Atmospheric Administration (NOAA) has developed an interactive interface to enable users to explore Historical Hurricane Tracks which can be explore by location, storm name, and ocean basin. This interface allows users to view storms from the late 1800s to present and includes barometric pressure readings, wind speeds, storm category, and more details plus the ability to download the data. This visualization can be viewed at: http://csc.noaa.gov/hurricanes/
The NOAA Historical Hurricane Tracks also allows users to refine their search by storm category, time frame, and even barometric pressure. This interface provides great visualizations of the life cycle of a hurricane and provides an interactive display of the path of the hurricane.
More Resources to Explore
Want to explore more details about hurricanes and historical hurricane visualizations? The following links include some additional resources related to hurricanes:
- National Weather Service National Hurricane Center – provides current information on tropical storms, hurricanes, wind speeds, storm surge, warnings, and more.
- NOAA Education Resources – Hurricanes – provides lesson plans and activities for K-12 teachers on storm surge, hurricanes and more.
- StormAdvisory Hurricane Tracking – provides a Google Maps based interface to view historical hurricane data from 1851 to Present.
- Weather Channel Hurricane Central – provides up to date information on tropical storms and hurricanes.