2011 American Community Survey Release Schedule

The U.S. Census Bureau schedule for the release of the American Community Survey data for 2011 starting in September of 2012 is now available. Included below are details on each release so be sure to make your calendars as this data will be available via the American FactFinder website once the data is released.

2011 American Community Survey — The Census Bureau plans to release one-year estimates from the 2011 ACS on Thursday, Sept. 20, 2012. The ACS produces estimates for numerous social, economic and housing characteristics including language, education, the commute to work, employment, mortgage status and rent, as well as income, poverty and health insurance. Embargo subscribers will have access on an embargoed basis to the estimates beginning Tuesday, Sept. 18. Estimates will be available for the nation, all 50 states, the District of Columbia, Puerto Rico, every congressional district, every metropolitan area, and all counties and places with populations of 65,000 or more. In June 2011, the ACS annual sample size was increased from 2.9 million to 3.54 million addresses, which should result in an improvement in the reliability of the estimates.

On Sept. 20, the Census Bureau will also release the first in a series of short briefs that analyze a wide range of topics. Additional briefs will follow. Each year, the Census Bureau varies the topics of these short briefs.

2009-2011 American Community Survey — The Census Bureau plans to release the three-year estimates from the 2009-2011 ACS on Oct. 25, 2012. Embargo subscribers will have access to the estimates up to 48 hours in advance of the public release. The estimates will cover all geographic areas with populations of 20,000 or more. They will include the first set of three-year estimates for field of degree of bachelor’s degree holders.

2007-2011 American Community Survey — The Census Bureau plans to release the five-year ACS estimates covering 2007-2011 on Dec. 6, 2012. Embargo subscribers will have access to the estimates on Dec. 4. These estimates are available for all areas regardless of population size, down to the block group.
The ACS Public Use Microdata Sample (PUMS) files for each of the three sets of statistics will be released one to two months after each public release.

Overviews provided by U.S. Census Bureau

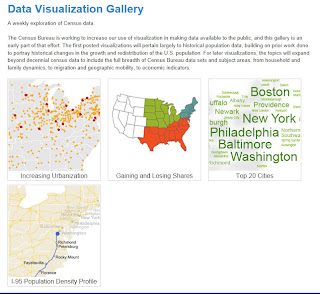
Data Visualization Gallery from the U.S. Census Bureau

Each week the U.S. Census Bureau is featuring a new data visualization on the census.gov website. These visualizations will highlight various datasets and variables provided by the U.S. Census Bureau with a new visualization posted each week.

Explore visualizations on the following:

Explore the most recent data visualizations from the U.S. Census Bureau at: http://www.census.gov/dataviz/

U.S. Census Bureau API now available

The U.S. Census Bureau has released an Application Programming Interface (API) to enable developers to create applications for the web and mobile platforms to enable users to explore census data via customized interfaces. The API enables developers to access the 2010 Census (Summary File 1) and the 2006-2010 American Community Survey (ACS) 5 Year Estimates allowing users to view data on population, age, sex, race, Hispanic origin, households, education, income, employment, commuting, occupations, housing, and more.

The U.S. Census Bureau has developed an “App Gallery” which will feature applications developed using the API. Currently there are two examples in the App Gallery that provide examples of the potential for using the Census API. These applications include:

  • Age-Finder – enables users to count population for single years or for a range of customized age ranges. 
  • Poverty Map – provides poverty statistics from the American Community Survey for New York state and includes an visualization of margin of error and more.

Want to explore the Census API and develop your own application? Developers can access the Census Bureau API at: http://www.census.gov/developers/.  Have an idea for an application using the API? Share your ideas through the Census Bureau’s Developers Forum.

Try out the Census Bureau API and if you create something be sure to share it with the U.S. Census Bureau. Enjoy!

Month in Review – CtSDC & MAGIC – July 2012

Month in Review – CtSDC & MAGIC – July 2012

The Connecticut State Data Center (CtSDC) and the University of Connecticut Libraries Map and Geographic Information Center (MAGIC) continue to expand upon our web resources to include more data, gis datasets, interactive maps, historical maps, and aerial photography. During the month of July 2012, MAGIC’s collections on Flickr had the largest number of views since we began using Flickr in 2009, user inquiries continue to increase, and several web resources experienced increases when compared to the same period just one year ago. Included below are highlights from July 2012 which focuses on five main areas: User Inquiries, Web Content Views, Trends in Webpage Usage, Trends in Keywords, and Projects in Progress.


I. User Inquiries

Total User Inquiries
Included below are the statistics for user inquiries received by phone, email, and in-person during July 2012. As the data clearly visualizes, the number of inquiries continues to rise with the year to date totals representing a 116% increase when compared to the January 1- July 31 of the previous year.


Total Inquiries
Monthly Change
vs. 2011
YTD Inquiries
for 2012
YTD Change
vs. 2011
Connecticut State Data Center
149
166%
835
67%
MAGIC
114
171%
849
112%

Total
263
168%
1,947
116%


II. Web Content Views

Total Unique Content Views
Included below are the web content unique views statistics for July 2012 which include comparisons with July 2011, the year to date (YTD) unique views and the change in the total number of unique views when compared to the same time period (January 1 – July 31)  from the previous year.

Web Resource
Unique Views
Monthly Change
vs. 2011
YTD Unique Views
for 2012
YTD Change
vs. 2011
Connecticut State Data Center
1,256
14%
10,748
12%
MAGIC 2.0 Online Maps
410
-53%
3,284
-49%
MAGIC  Flickr Collections
43,822
115%
244,135
55%
MAGIC News Blog (Retired)
24
-20%
245
11%
MAGIC Website
10,916
23%
86,046
11%
Outside the Neatline Blog
867
19%
6,118
44%

Total*
57,278
79%
350,983
37%
* Total includes CT View

Total Content Views
With more users viewing web content more than once from MAGIC and the Connecticut State Data Center, the total views of web content provides a more detailed view of the trends in usage. The following table includes the usage trends for the total number of views, monthly change when compared to same month in 2011, the year to date (YTD) total number of views and the change in total views when compared to the same time period (January 1 – July 31) from the previous year.

Web Resource
Total Views
Monthly Change
vs. 2011
YTD Total Views
for 2012
YTD Change
vs. 2011
Connecticut State Data Center
1,769
10%
15,905
10%
MAGIC 2.0 Online Maps
2,646
-64%
31,384
-56%
MAGIC  Flickr Collections
43,822
115%
244,135
55%
MAGIC News Blog (Retired)
40
33%
350
36%
MAGIC Website
16,863
21%
135,690
13%
Outside the Neatline Blog
1,190
24%
8,319
42%

Total*
66,330
50%
435,797
18%
* Total includes CT View

III. Trends in Webpage Usage – July 2012
Ever wondered what the most popular pages are at MAGIC and the Connecticut State Data Center? Included below are the top 5 most popular pages for July 2012.

Most Popular pages – Connecticut State Data Center
Page
Total Views
488
371
263
201
146

Most Popular pages – MAGIC 
Page
Total Views
3,359
  2,806
1,082
985
783


Most Popular pages – Outside the Neatline Blog 
Page
Total Views
105
     73
72
70
49


IV. Trends in Keywords – July 2012
At the Connecticut State Data Center and MAGIC each month we analyze keyword searches conducted on our websites to determine areas to focus increasing accessing to maps, data, and resources. Keyword provide us with an opportunity to see trends, areas for improvement, and have been integral to providing guidance on website development and improvements. Included below are keyword trends for July 2012.

Most Frequent Keywords – Connecticut State Data Center
Keyword
gross state product
1980 census
2030 ct population
ACS data base
  
Most Frequent Keywords – MAGIC
Keyword
Stonington
campus map
Fairfield
New Haven
1934

V. Projects in Progress – July 2012
Each month the students and staff at MAGIC and the Connecticut State Data Center are working on a series of projects, tasks, data sets, and resources which users typically don’t know about until we add the resource to our website. Included below is a list of projects that are currently underway which will be completed in the coming months and made available in their final forms via our websites.

  • Connecticut Population Projections 2015-2025 – This project involves developing updated population projections based on the 2010 Census, Birth and Mortality data from the Connecticut Department of Public Health, and developing derived migration based on these data for multiple levels of geography. Over the past month we have been refining the methods by incorporating additional data which will enable additional age groupings to be provided while also providing the ability to calculate more detailed rates of survival to improve the projections. Throughout this process we have been preparing scripts to help process the data for the projections which will enable future updates to be conducted on an annual basis (if necessary). This project is still underway and the public is able to view a preliminary version (population estimates are subject to change as we refine the methods over the next month). View the preliminary projections and the interactive data interface at: http://ctsdc.uconn.edu/projections.html
  • Data Visualization – This project involves testing new tools and methods for visualizing data at the Connecticut State Data Center and MAGIC. Testing has included Tableau, Google Fusion Tables, and ArcGIS Online to determine which solution(s) are best depending upon the data visualization needed (maps, graphs/charts, or combinations).
  • Google Floor Maps – in collaboration with colleagues from the UConn Libraries Undergraduate Education team, we have begun developing updated floor maps for the storrs campus libraries (regional campuses will be included at a future date) to contribute these maps to the Google Maps Floor maps for Android. We have uploaded our first map and once approved, google maps users will be able to view a generalized floor map to help navigate public areas within the building. Learn more about this in the following article from Wired.
Have an idea for a project or suggestions for improvements to MAGIC and the Connecticut State Data Center’s website and web offerings? Leave us a comment or contact us at magic@uconn.edu.  


Each month we will be posting a “Month in Review” article so check back next month to see the latest information on usage trends at MAGIC and the Connecticut State Data Center.