Digital Humanities Virtual Meeting – August 13, 2012

Interested in sharing ideas and learning more about digital humanities, collaborative projects, and geospatial tools and potential projects for Connecticut? The Connecticut State Library will be hosting the second digital humanities video chat which is designed to share ideas on emerging tools, resources, and project ideas for digital humanities with a focus on potential projects focused on Connecticut.

This video meeting will focus on collaborative projects, using geospatial tools to teach and present history in new ways, using Google Refine to clean your metadata, and additional more. Presenters will include:

Date: August 13, 2012

Time: 12:00pm-1:00pm


How to Participate: View Connecticut State Library Blog Post for more details


Want to Review the Video from our First Meeting?
View our previous digital humanities chat on YouTube

Quarterly Survey of Public Pensions – First Quarter 2012

Quarterly Survey of Public Pensions for 1st Quarter 2012 Now Available

This U.S. Census Quarterly Survey of Public Pensions (formerly known as the Finances of Selected State and Local Government Employee Retirement Systems Survey) provides national summary statistics on the revenues, expenditures and composition of assets of the 100 largest state and local public employee retirement systems in the United States. These 100 systems comprise 89.4 percent of financial activity among such entities, based on the 2007 Census of Governments.

This survey presents the most current statistics about investment decisions by state and local public employee retirement systems, which are among the largest types of institutional investors in the U.S. financial markets. These statistical tables are published three months after each calendar quarter and show national financial transactions and trends for the past five years.

To view this data, summary report, and download the data visit http://www.census.gov/govs/qpr/.

Public Education Finances: 2010

The nation’s elementary-secondary public school systems spent an average of $10,615 per pupil in fiscal year 2010, up 1.1 percent from the previous year, according to statistics released on June 21, 2012 by the U.S. Census Bureau. The state of Connecticut’s public schools spent $14,906 per student in 2010, placing Connecticut 7th in the nation in per student spending in 2010 with the District of Columbia public schools having the highest per student expenditure of $18,667 in 2010. A complete table with rankings by state is available from the U.S. Census Bureau (See table 11. Excel | PDF).

These updated statistics are included in the U.S. Census Bureau’s Public Education Finances: 2010 report, a report the provides data on revenues, expenditures, debt and assets of elementary and secondary public school systems from across the nation for the 2010 fiscal year. The tables include detailed statistics on spending — such as instruction, student transportation, salaries and employee benefits — at the national, state and school district levels.

Other highlights from this report include:

  • States that spent the least per pupil were Utah ($6,064), Idaho ($7,106), Arizona ($7,848) and Oklahoma ($7,896).
  • All nine states in the Northeast region of the U.S. were ranked among the top 15 in per pupil spending in 2010. Out of the 16 states with the lowest per pupil spending, 15 were in the South or West regions. The remaining state, South Dakota, is in the Midwest.
  • Of the 50 largest school systems by enrollment in the U.S., New York City School District ($19,597), Montgomery County Public Schools in Maryland ($15,582), Baltimore City Public Schools in Maryland ($14,711), Milwaukee Public School in Wisconsin ($14,038) and Prince George’s County Public Schools in Maryland ($14,019) had the highest per pupil spending in 2010.
  • Instructional expenditures accounted for the largest spending category for public education, totaling $317.8 billion in 2010, of which $211.1 billion (66.4 percent) went to instructional salaries and wages.
  • Public school systems in North Dakota (22.0 percent), Mississippi (21.2 percent), New Mexico (20.7 percent) and Idaho (20.4 percent) received the highest percentage of their revenues from the federal government, while public school systems in New Hampshire (6.6 percent), New York (6.7 percent) and the District of Columbia (6.7 percent) received the lowest.
  • Property taxes accounted for 64.8 percent of revenue from local sources for public school systems.
  • Total school system debt increased by 1.9 percent to $406.9 billion in 2010. 
View the complete report and download data in excel format at: http://www.census.gov/govs/school/


The data used in the tabulations came from a census of all 15,345 public school systems. As such, they are not subject to sampling error. Although quality assurance methods were applied to all phases of data collection and processing, the data are subject to nonsampling error, including errors of response and miscoding. For more information, visit the Census Bureau’s website at <http://www.census.gov/govs/school/>.

U.S. Employer Businesses Show Declines in Establishments and Employees in 2010, Census Bureau Reports

U.S. Employer Businesses Show Declines in Establishments and Employees in 2010, Census Bureau Reports

In 2010, U.S. businesses with paid employees numbered 7.4 million, a decline of 36,800 establishments from 2009, marking the third consecutive year of decline, according to the U.S. Census Bureau. In comparison, between 2008 and 2009 there was a decline of 168,000 establishments.


These findings are from County Business Patterns: 2010, which provides the only detailed annual information on the number of establishments, employees, and first-quarter and annual payroll for most of the 1,100 industries covered at the national, state and county levels. The statistics are broken down according to employment-size classes (for example, number of establishments with one to four employees) and legal form of organization (for example, corporations and partnerships).


In 2010, total employment from all sectors was 112.0 million, a decline of 2.5 million employees from 2009. In comparison, between 2008 and 2009 there was a decline of 6.4 million employees.


“This year’s release of the County Business Patterns shows the overall decline in employment is slowing,” said William G. Bostic Jr., associate director for economic programs at the Census Bureau. “In contrast, 2009 coincided with the height of the recession and showed higher declines in employment and establishments.”


Between 2009 and 2010, only Alaska showed a rise in employment from the previous year, having increased 0.7 percent. All other states showed declines in employment, led by Wyoming’s 4.5 percent decline from 2009.


Among the top 50 counties in the United States by number of establishments, the largest decline in total annual payroll was Los Angeles County, Calif., with a decrease of nearly $2 billion. This was a decrease of 1.1 percent from 2009. Only Kings County, N.Y., showed an increase in the number of employees with an additional 4,400 from the previous year.


The retail trade sector had the highest number of establishments (1.1 million). Next were professional, scientific and technical services (851,506); health care and social assistance (812,860); other services (except public administration) (725,488); construction (682,684); and accommodation and food services (643,960).


The construction sector showed the largest percentage decline in establishments, decreasing 4.2 percent from 2009 to 2010. The finance and insurance sector had the second largest decline, falling 3.2 percent from 2009 to 2010. The remaining top five sectors that showed the largest decline in establishments were manufacturing (2.9 percent), management of companies and enterprises (1.4 percent), and wholesale trade (1.2 percent).


Among industries that showed an increase in establishments, both utilities and health care and social assistance saw the largest increase, rising 1.7 percent from the previous year. The remaining top five industries that showed the largest increase in establishments were educational services (1.5 percent); accommodation and food services (1.4 percent); and professional, scientific, and technical services (1.1 percent).

County Business Patterns excludes business owners who were self-employed, employees of private households, railroad employees, agriculture production workers and most government employees. Information on businesses without paid employees is released as part of the upcoming 2010 Nonemployer Statistics report. County Business Patterns data by five-digit ZIP codes will be released this summer.

County Business Patterns 2010 – Connecticut Data


For Connecticut, users can view data at the state and county levels for 2010 from the County Business Patterns Homepage at: http://www.census.gov/econ/cbp/. From this page you will be able to access data on the total number of paid employees by NAICS code, view payroll information, identify the total number of establishments, and more. Included below is a brief table of the number of establishments in Connecticut by employment-size class based on the 2010 County Business Patterns dataset.


Number of establishments by employment-size class (2010) – Connecticut

NAICS code NAICS code description Total
establish-ments
1-4 5-9 10-19 20-49 50-99 100-249 250-499 500-999 1000
or more
—— Total for all sectors 89,234 47,372 17,338 11,932 7,835 2,591 1,638 332 110 86
11—- Agriculture, forestry, fishing and hunting 78 57 16 3 2 0 0 0 0 0
21—- Mining, quarrying, and oil and gas extraction 71 34 16 13 5 1 1 1 0 0
22—- Utilities 169 42 21 24 28 29 15 7 1 2
23—- Construction 8,187 5,904 1,129 660 358 82 47 6 1 0
31—- Manufacturing 4,473 1,669 825 713 669 317 201 48 23 8
42—- Wholesale trade 4,418 2,328 822 587 430 139 86 15 6 5
44—- Retail trade 12,940 6,075 3,011 1,899 1,259 343 323 29 1 0
48—- Transportation and warehousing 1,641 748 260 217 219 119 57 14 6 1
51—- Information 1,649 786 267 243 193 86 54 14 5 1
52—- Finance and insurance 6,339 3,336 1,487 849 364 153 83 32 18 17
53—- Real estate and rental and leasing 3,232 2,267 570 261 91 33 6 2 1 1
54—- Professional, scientific, and technical services 9,477 6,301 1,455 954 508 150 78 18 7 6
55—- Management of companies and enterprises 717 268 120 95 86 60 52 24 8 4
56—- Administrative and support and waste management
and remediation services
5,241 3,307 775 500 367 130 117 32 9 4
61—- Educational services 1,296 578 227 184 155 70 55 13 3 11
62—- Health care and social assistance 10,257 3,890 2,464 1,951 1,114 373 358 66 17 24
71—- Arts, entertainment, and recreation 1,607 840 244 216 184 91 25 6 1 0
72—- Accommodation and food services 8,004 3,176 1,512 1,528 1,379 345 59 2 1 2
81—- Other services (except public administration) 9,291 5,625 2,115 1,031 424 70 21 3 2 0
99—- Industries not classified 147 141 2 4 0 0 0 0 0 0


County Business Patterns defines employment as all full- and part-time employees who were on the payroll during the pay period that includes March 12. Data are obtained from Census Bureau reports and administrative records from other federal agencies. Quality assurance procedures are applied to all phases of collection, processing and tabulation to minimize errors. The data are subject to error from miscoding and estimation for missing or misreported data. Values associated with each establishment are slightly modified to protect the confidentiality of the location. Further information about methodology and data limitations is available at <http://www.census.gov/econ/cbp/methodology.htm>.

Source: U.S. Census Bureau & Connecticut State Data Center

Summary of State and Local Government Tax Revenue: 1st Quarter 2012

Summary of State and Local Government Tax Revenue: 1st Quarter 2012

The U.S. Census Bureau’s Quarterly Summary of State and Local Government Tax Revenue provides quarterly estimates of state and local government tax revenue at a national level, as well as detailed tax revenue data for individual states. This quarterly survey has been conducted continuously since 1962. The information contained in this survey is the most current information available on a nationwide basis for government tax collections.

The 1st Quarter 2012 of the U.S. Census Bureau’s Summary of State and Local Government Tax Revenue has recently been released and indicates a total tax revenue of $3,604,124,000 for Connecticut during the 1st Quarter of 2012. Included below is the tax information for Connecticut from the U.S. Census Bureau’s Summary of State and Local Government Tax Revenue data for the 1st Quarter of 2012.

STATE TAX COLLECTIONS FOR CONNECTICUT AND TYPE OF TAX
1st Quarter 2012 (January , February, March)

Tax Description Code Connecticut
Total 
  $3,604,124,000
Property tax T01
X
General sales and gross receipts T09
$947,370,000
Motor fuel sales taxes T13
$115,191,000
Alcoholic beverages T10
$13,537,000
Public utilities T15
$55,786,000
Insurance T12
$88,478,000
Tobacco products T16
$91,950,000
Pari-mutuels T14
$1,719,000
Amusements T11
$100,079,000
Other selective sales and gross receipts T19
$134,698,000
Alcoholic beverages T20
$2,013,000
Public utilities T27
$176,000
Motor vehicles T24
$56,470,000
Motor vehicle operator T25
$10,587,000
Corporations in general T22
$7,606,000
Hunting and fishing licenses T23
$471,000
Amusements T21
$40,000
Occupation and business licenses T28
$30,963,000
Other licenses taxes T29
$2,314,000
Individual income taxes T40
$1,686,963,000
Corporation net income taxes T41
$212,989,000
Death and gift taxes T50
$18,649,000
Severance taxes T53
$15,000
Documentary and stock transfer taxes T51
$23,649,000
Other miscellaneous taxes T99
$2,411,000

View and Download Data
View additional states, the nation, and previous quarters of data from the U.S. Census Bureau at: http://www.census.gov/govs/qtax/

Nationwide Summary Report
View the National Summary Report for the 1st Quarter 2012 at: http://www2.census.gov/govs/qtax/2012/q1_infosheet.pdf

CT Data.org Webinars – July 2012

The Connecticut Data Collaborative is sponsoring webinars and training opportunities for data generators and users to learn how to use the new CTData.org portal.  

Bringing Data Alive! An Introduction to CTData.org

In this introductory webinar, CTData.org project coordinator Jim Farnam will explain the structure and organization of the site, how to access the data and metadata, data visualization options and customizations, and ways to share your data visualizations with others.

Release Your Inner Data Wonk: Using Advanced Weave Data Visualization Tools on CTData.org

In this webinar, CTData.org project coordinator Jim Farnam will explain the structure and organization of the site, how to access the data and metadata, and provide training in use of the advance Weave data visualization tools.


Older Populations to Exceed Children in Most World Regions by 2050, Census Bureau Reports

Older Populations to Exceed Children in Most World Regions by 2050, Census Bureau Reports

The world’s inhabitants in 2012 are an older mix of people than was the case a decade ago, driven by declining fertility and increasing life expectancy. According to new U.S. Census Bureau population projections, by midcentury most world regions will resemble Europe, which in 2005 became the first major world region where the population 65 and older outnumbered those younger than 15 (see Figure 1).

Figure 1: Europe Population Pyramid: 2005

Northern America, which includes Canada and the United States, will have joined Europe in this historic reversal of age group sizes by 2050 (see Figure 2), as will Asia (Figure 3), Latin America (see Figure 4) and Oceania (which includes Australia and New Zealand) (see Figure 5).

Figure 2: Northern America Population Pyramid 2050
Figure 3: Asia Population Pyramid 2050
Figure 4: Latin America and the Caribbean Population Pyramid 2050

Figure 5: Oceania (Includes Australia and New Zealand) Population Pyramid 2050
Moreover, China is projected to move from having nearly twice as many people in the younger age group than in the older one in 2012, to the opposite situation by midcentury (see Figure 6).
Figure 6: China Population Pyramid 2050

Each of these projections come from an update of the Census Bureau’s International Data Base, which includes estimates by age and sex to 100 years and older for countries and other areas with populations of 5,000 or more and provides information on population size and growth, mortality, fertility and net migration.

Since April 2012, users of the International Data Base have been able to obtain population in single years of age, allowing them to calculate country-specific populations in particular age groups (e.g., population at selected ages younger than 5, or adolescents).

Between now and the middle of the 21st century, global population will continue aging. The percentage of population 65 and older will more than double, from 8 percent today to nearly 17 percent in 2050, carrying with it well-established changes in the mix of communicable and noncommunicable disease patterns in populations, health care burden, pension systems, the composition and character of the labor force, and other economic variables, such as savings and consumption patterns.

One world region — Africa — will continue to have populations younger than 15 that are much larger than those 65 and older, but even there, the balance will have shifted toward the older group (see Figure 7).

Figure 7: Africa Population Pyramid 2050


View and Download Data
Want to explore additional population projections by country or region? View the data included in the charts above and more from the U.S. Census Bureau’s International Programs – International Data Base page at: http://www.census.gov/population/international/data/idb/informationGateway.php

This news release was provided by the U.S. Census Bureau with graphics added by the Connecticut State Data Center.

2010 Census of Population and Housing Units Counts – Connecticut

2010 Census of Population and Housing Unit Counts – Connecticut

The U.S. Census Bureau has just released a new report based on the 2010 Census for Population and Housing Unit Counts for Connecticut. This report includes housing units, population by urban and rural areas and more. Several of the tables also include historical census data at the state, county, county subdivision, place, and/or minor civil division levels for Connecticut.

This report provides easy to read tables of data which provides the same data available from the American FactFinder in a streamlined report. This report also includes population density, housing density and additional details which may be helpful to our readers.

Check out the full report at: http://www.census.gov/prod/cen2010/cph-2-8.pdf

GeoFocus Summer 2012 Now Available

The Connecticut GIS User to User Network and the Connecticut GIS Council Education and Outreach Working Group’s latest issue of GeoFocus, CT’s Quarterly Geospatial Newsletter is now available. Included below are just a few highlights from the Summer 2012 (June) issue:

  • Editorial: Data Sharing Law Passes!
  • Using Smartphones to Maintain Streetlights
  • Connecticut Orthophoto Update
  • Census Q&A
  • Measure Tree Canopy
  • New Population Projections for Connecticut
  • State POCD Map Changes
  • Letter from Thad Dymkowski – President of the Connecticut GIS User to User Network
  • And more!
Check out the latest issue today!
Interesting in contributing to CT GeoFocus?
If you are interested in submitting articles for the next issue of GeoFocus, details are provided on page 2 of the newsletter. Articles for the next issue are due by 8/30/2012.

Month in Review – CtSDC at MAGIC – June 2012

Month in Review – CtSDC & MAGIC – June 2012
To provide our readers with a summary of usage trends, the Connecticut State Data Center (CtSDC) and the University of Connecticut Libraries Map and Geographic Information Center (MAGIC) will be publishing a summary report for each month to this blog. This summary report provides our readers with an opportunity to view trends in usage of webpages, examine trends in keyword searches, and will feature a brief overview of projects in development. Included below are highlights from June 2012 which focuses on five main areas: User Inquiries, Web Content Views, Trends in Webpage Usage, Trends in Keywords, and Projects in Progress.
I. User Inquiries
Total User Inquiries
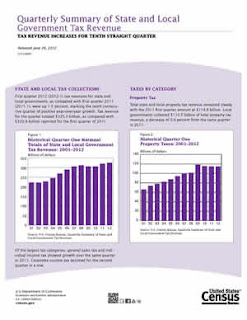
Included below are the statistics for user inquiries received by phone, email, and in-person during June 2012. As the data clearly visualizes, the number of inquiries continues to rise with the year to date totals representing a 109% increase when compared to the January 1- June 30 of the previous year.
Web Resource
Total Inquiries
Monthly Change
vs. 2011
YTD Inquiries
for 2012
YTD Change
vs. 2011
Connecticut State Data Center
161
35%
835
88%
MAGIC
128
83%
849
136%
Total
289
53%
1,684
109%


II. Web Content Views
Total Unique Content Views
Included below are the web content unique views statistics for June 2012 which include comparisons with June 2011, the year to date (YTD) unique views and the change in the total number of unique views when compared to the same time period (January 1 – June 30)  from the previous year.
Web Resource
Unique Views
Monthly Change
vs. 2011
YTD Unique Views
for 2012
YTD Change
vs. 2011
Connecticut State Data Center
1,951
21%
9,492
12%
MAGIC 2.0 Online Maps
410
-53%
3,284
-49%
MAGIC  Flickr Collections
35,066
77%
200,313
46%
MAGIC News Blog (Retired)
35
75%
221
16%
MAGIC Website
10,622
21%
75,130
10%
Outside the Neatline Blog
953
59%
5,251
49%

Total
49,038
55%
293,705
31%
Total Content Views
With more users viewing web content more than once from MAGIC and the Connecticut State Data Center, the total views of web content provides a more detailed view of the trends in usage. The following table includes the usage trends for the total number of views, monthly change when compared to same month in 2011, the year to date (YTD) total number of views and the change in total views when compared to the same time period (January 1 – June 30) from the previous year.
Web Resource
Total Views
Monthly Change
vs. 2011
YTD Total Views
for 2012
YTD Change
vs. 2011
Connecticut State Data Center
2, 716
9%
14,136
10%
MAGIC 2.0 Online Maps
3,044
-62%
28,738
-56%
MAGIC  Flickr Collections
35,066
77%
200,313
46%
MAGIC News Blog (Retired)
55
175%
310
36%
MAGIC Website
16,474
21%
118,827
12%
Outside the Neatline Blog
1,288
61%
7,129
45%
Total
58,644
31%
369,467
13%
III. Trends in Webpage Usage – June 2012
Ever wondered what the most popular pages are at MAGIC and the Connecticut State Data Center? Included below are the top 5 most popular pages for June 2012.
Most Popular pages – Connecticut State Data Center
Page
Total Views
916
579
397
132
124
Most Popular pages – MAGIC 
Page
Total Views
3,362
  2,865
1,105
911
773
Most Popular pages – Outside the Neatline Blog – June 2012
Page
Total Views
166
     71
65
61
43

IV. Trends in Keywords – June 2012
At the Connecticut State Data Center and MAGIC each month we analyze keyword searches conducted on our websites to determine areas to focus increasing accessing to maps, data, and resources. Keyword provide us with an opportunity to see trends, areas for improvement, and have been integral to providing guidance on website development and improvements. Included below are keyword trends for June 2012.

Most Frequent Keywords – Connecticut State Data Center
Keyword
Demographic Profile Senate
Family statistics
06050
1940 Census Data West Hartford
  
Most Frequent Keywords – MAGIC
Keyword
Campus map
parcels
Appalachian trail
Canaan
Elevation

V. Projects in Progress – June 2012
Each month the students and staff at MAGIC and the Connecticut State Data Center are working on a series of projects, tasks, data sets, and resources which users typically don’t know about until we add the resource to our website. Included below is a list of projects that are currently underway which will be completed in the coming months and made available in their final forms via our websites.

  • Connecticut Population Projections 2015-2025 – This project involves developing updated population projections based on the 2010 Census, Birth and Mortality data from the Connecticut Department of Public Health, and developing derived migration based on these data for multiple levels of geography. This project is still underway and the public is able to view a preliminary version (population estimates are subject to change as we refine the methods over the next month). View the preliminary projections and the interactive data interface at: http://ctsdc.uconn.edu/projections.html
  • Air Navigation Maps 1923-1935 Index – This project, developed by Trevor Rzucidlo during his internship and independent study at MAGIC during Fall 2011-Spring 2012, provides an interactive index to a series of over 150 historical air navigation maps from 1923-1935 for the United States. The index is currently available and additional georeferenced maps are being added in the coming weeks. The interface provides users with quick access to individual maps and is based on Google Fusion Tables. Check out this index at: http://magic.lib.uconn.edu/mash_up/air_navigation_index.html
  • Aerial Photography TIFFs and PDFs Project – In the coming months users will be able to access full-quality TIFF, GeoTIFF, and PDF images for aerial photography from 2004, 2006, 2008, 2009, and 2010 via a series of interactive indexes based on Google Fusion Tables. Once completed, users will be able to download TIFF, GeoTIFF, and PDF images for a location directly from the interactive aerial photography index.
Have an idea for a project or suggestions for improvements to MAGIC and the Connecticut State Data Center’s website and web offerings? Leave us a comment or contact us at magic@uconn.edu.  


Each month we will be posting a “Month in Review” article so check back in a month to see the latest information on usage trends at MAGIC and the Connecticut State Data Center.