East Coast Power Outage Maps

https://www.ssd.noaa.gov/goes/east/eaus/rb-l.jpg
From the National Hurricane Center

As Hurricane Sandy approaches the Mid-Atlantic and New England here are some online resources to keep track of power outages.  We know that if you lose power these sites will be of little help, but you could share them with friends and relatives at a distance so they can give you updates.

Virginia:
Dominion Electric 

Maryland:
Maryland Power Outages 

Delaware:
Delmarva Power 
Delaware Electric Co-op 

District of Columbia:
Pepco

New Jersey:
Jersey Central Power and Light
PSE&G

Pennsylvania:
Multiple Carriers from First Energy

New York:
ConEdison
National Grid (Upstate)
Long Island Power Authority (LIPA)

Connecticut:
Connecticut Light & Power
United Illuminating Company

Rhode Island:
National Grid

Massachusetts:
National Grid
Western Massachusetts Electric

Vermont:
Vermont Outages

New Hampshire:
Public Service of New Hampshire
New Hampshire Electric Co-op

Maine:
Central Maine Power 

As always never forget to check with the National Weather Service and the National Hurricane Center for further update.  Be safe!

Geography Awareness Kick-off Event – November 8, 2012

Please join us for an evening of food, fellowship, and geography. The Connecticut Geographic Alliance along with the National Geographic Society, University of Connecticut Department of Geography, and the Connecticut Data Center at the University of Connecticut Libraries Map and Geographic Center (MAGIC) would like you to explore the theme of interdependence. 


What: Geography Awareness Kick-off Event 

Where: University of Connecticut – Storrs Campus

When: November 8, 2012

Time: 4:30-8:30pm


Program Agenda
4:00‐5:15       Pre‐conference Teale Lecture – “The Long Thaw: How Humans are Changing the Next 100,000 Years of Earth’s Climate” by Dr. David Archer, Professor of Geophysical Sciences, University of Chicago (held at the Konover Auditorium of the Dodd Center)
4:30‐5:30       Registration
5:30‐5:40       Welcome – Andy Jolly-Ballantine & Bill DeGrazia, CGA Co‐Coordinators
5:40‐6:40       Keynote Address – “Globalization from the Ground Up” by
                        Mark Boyer, GlobalEd Project and Chair of Political Science, UConn
6:40‐7:20       Buffet Dinner and Remarks
7:25‐8:15       Breakout Sessions with Victoria Despres, Kristie Blanchard, and possibly others; check out the CGA website for an updated list!
8:15‐8:30       CEU Records and Drawings

Registration
To register and to view the complete agenda for this 
http://www.ctgeoalliance.org/awareness-week-kickoff.html


Who Should Attend
Teachers, Professors, Pre-service teachers, Student Teachers, and the UConn community at large. We are all connected through the decisions we make on a daily basis.  


Questions
Please contact committee member, William A. DeGrazia, at william.degrazia@uconn.edu should any questions arise.


Geography of the Foreign-Born Population, 1960-2010: Census Bureau Report

The foreign-born population of the United States has shifted since 1960 from a largely European composition of nation of origin settled in Northeastern and Midwestern states to, present-day, people of Asian and Latin American origin living more in the west and south of the country. This is the central finding of a new working paper from the U.S. Census Bureau’s Population Division, The Size, Place of Birth, and Geographic Distribution of the Foreign-Born Population in the United States: 1960 to 2010, released earlier this month.

In 1960, the top five countries of origin for immigrants to the United States – Italy, Germany, Canada, United Kingdom, Poland – comprised 49.1 percent of the country’s total foreign-born population. In 2010, however, the five largest nationalities represented in the immigrant population of the country were Mexico, China, India, Philippines, and Vietnam. These five comprised 46.7 percent of the total foreign-born population, with people from Mexico making up nearly 30 percent of that composition. This significant difference in the nations of origin, as the composition shifts from immigrants of European countries to Latin American and Asian nations, is highlighted in the report.

Also discussed in this report is the demographic shift in age to a younger population, from a median age of 57.3 in 1960 to 41.4 in 2010. These start and end data hide the fact that, for the years 1980, 1990, and 2000, the median age dropped below 40, reaching a nadir of 37.2 in 1990. The authors of the report understand this trend to be a result of the decline of the older European population through mortality, in combination with the influx of a younger Asian and Latin American immigrant population.

In the state of Connecticut, the report presents data showing a U-shaped transition in the state’s foreign-born population during the study period of 1960 to 2010. First, during the period of 1960 to 1990, the number of foreign-born people varied within 20,000 between any two Census years. This stagnancy in total numbers explains the decline in the foreign-born population as a proportion of the total Connecticut population, increasing during the entire study period. The population of foreign-born residents dropped from 10.9 percent of the total population in 1960 to 8.5 percent in 1990.

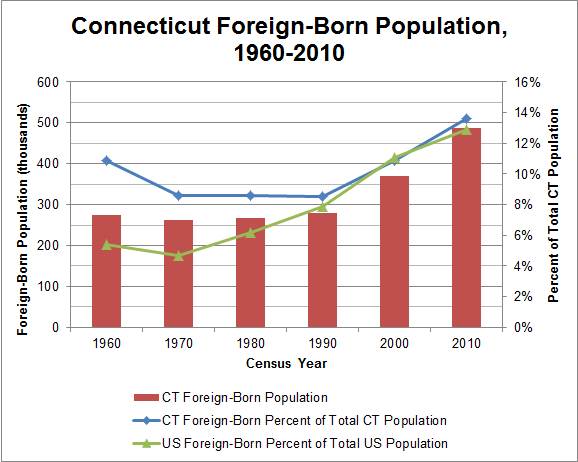
More recently, however, the Census data shows a significant growth in Connecticut’s foreign-born population, nearly doubling from approximately 279,000 in 1990 to just over 487,000 in 2010. As a percentage of the total state population, the foreign-born cohort also increased to 13.6 percent in 2010. In the chart above, this latter, increasing trend in the state’s foreign-born population matches relatively closely to the change in the population composition percentages for the entire United States, which has been steadily increasing since 1970.

View the entire report here: The Size, Place of Birth, and Geographic Distribution of the Foreign-Born Population in the United States: 1960 to 2010.

Connecticut GIS Day – Call for Presenters and Posters

Connecticut GIS Day is fast approaching and there is still time to submit topics for presentations and poster sessions. This is a great venue to share research that utilizes GIS tools, spatial techniques, and interactive mapping resources so if you are interested in presenting or submitting a poster forward a title and a brief biography of the presenters to Thad Dymkowski, President of the Connecticut GIS User to User Network, at  TDymkowski@NewingtonCT.Govby October 22, 2012.
For those considering submitting a poster, the posters will be displayed at the Legislative Office Building in Hartford, CT for the entire month of November. Included below are additional details pertaining to GIS Day presentations and posters.
Presentations
If you are interested in doing a 15 minute presentation or a 5 minute poster talk, please contact Thad at TDymkowski@NewingtonCT.Govand provide a title and biography for the speaker.
Table Display
If you’d like to set up a table display, contact Thad at TDymkowski@NewingtonCT.Govto reserve a table.
Posters
Posters will be on display in the concourse of the Legislative Office Building for the entire month of November, beginning November 1. Maps should be minimum 24” x 36” and mounted on foam board or similar material. If you are interested in submitting a poster, please contact Thad at  TDymkowski@NewingtonCT.Gov and provide the title for your poster and a brief biography of the authors of the poster.
Connecticut GIS Day will be held on Friday November 16, 2012 at the University of Connecticut Avery Point Campus in the Marine Sciences building from 9am-3pm. Additional details about GIS Day are available at: http://ctgis.uconn.edu

Community Indicators Consortium (CIC) Impact Summit

The Community Indicators Consortium (CIC) Impact Summit International Conference will be held November 15-16, 2012 at the University of Maryland in College Park, MD. This conference will showcase leading monitoring and measuring methods, impact and communication strategies, and innovative approaches in community health, sustainability, education, economic development and more topics. This conference will feature multiple presentations from national and internationally recognized scholars, organizations, and agencies including Dr. Robert Groves (former head of the US Census Bureau), HUD, US Department of Health and Human Services, Community Action Network, Boston Indicators Project just to name a few!

When: November 15-16, 2012
Where: Samuel Riggs IV Alumni Center – University of Maryland College Park, Maryland
Cost: See Website for full listing of rates.

For additional information and to register visit: http://www.communityindicators.net/conference2012

Census Bureau Briefs and Special Reports, September 2012

In the past weeks, the U.S. Census Bureau has produced several new reports based upon their continuing analysis of 2010 Decennial Census data in conjunction with other ongoing research and assessments they make of the American population and our lives. These reports, summarized below, cover a broad range of both the knowledge Census data makes possible and of the work of the Bureau.

    The residential populations of the downtown centers of many of the country’s largest cities have grown at rates of ten percent or more, between 2000 and 2010. The Census Bureau arrived at this finding by considering the population living within two miles of the city hall, in relation to the overall population of the metropolitan region. This and other new analysis have been made available in the new special report, Patterns of Metropolitan and Micropolitan Population Change: 2000 to 2010.

    • Among micropolitan statistical areas across the country, the Torrington Connecticut micropolitan statistical area held the second highest population, with 189,927 people in 2010. And in comparison to such micropolitan areas, Torrington also had the second highest percentage of people between ages 45 through 54, at 18.2 percent.

      In The Emergency and Transitional Shelter Population: 2010, a 2010 Census Special Report, the numbers tabulated refer only to the population counted at emergency and transition shelters with overnight facilities and only at the time of the Decennial Census enumeration. The emergency and transitional shelter population was counted in conjunction with counts at soup kitchens, mobile food vans, and other non-shelter outdoor locations as part of Census Bureau’s Service-Based Enumeration Operation. The total of these data, however, do not represent an accurate count of the country’s entire homeless population.

      • For the State of Connecticut, there were 2,244 people living in emergency and transitional shelters in 2010, of which more than two-thirds were male and nearly 18 percent were children under 18 years old.


        The Census Bureau began giving the option for people to identify as belonging to more than one race in the 2000 Decennial Census. Out of the 2010 Census, therefore, has come the first comparative analysis of racial identity that includes multiple-race categories. One of the most striking findings examined in this brief, The Two or More Races Population: 2010, is that the population of people of two or more races grew significantly faster than the single race population, at rates of more than 50 percent in some geographies (compared to 9.7 percent overall U.S. population growth).

        • Between 2000 and 2010, the population of two or more races in Connecticut increased 23.8 percent, from 74,848 people in 2000 to 92,676 in 2010. But this change only altered the state population composition of multiple-race residents from 2.2 percent in 2000 to 2.6 percent in 2010, which matches the multiple-race population composition for the Northeast Census region in general.

        The Census Bureau conducts an ongoing longitudinal study of income, demographics, and health insurance called the Survey of Income and Program Participation (SIPP), in order to obtain a representative sample of health and medical trends in the American population. For the newly released brief of the Household Economic Studies, Health Status, Health Insurance, and Medical Services Utilization: 2010, between approximately 50,000 and 65,000 respondents were interviewed regularly between 2001 and 2010. The survey collected a combination of quantitative economic, medical and demographic statistics along with self-reported evaluations of health status. Among the survey’s findings, the Census Bureau reports that the frequency of doctor visits per year has declined across the entire population throughout the study period, regardless of insurance coverage or health status.


        Each year, the Census Bureau aggregates the data on financial status of state and local governments in the Annual Surveys of State & Local Government Finance. The 2010 data have recently been released, and are summarized in the report State and Local Government Finances Summary: 2010. The statistics enclosed cover both revenues and expenditures, debts and assets. For revenue, state and local governments overall saw a large increase of 51 percent from 2009 to 2010. In expenditures, education continued to be the largest overall expense across governments, as illustrated in the Census Bureau’s map below.

          National Historical GIS of the Minnesota Population Center releases time series Census data

          The National Historical Geographic Information System has recently announced its initial release of time series tables of U.S. Census data.

          Freely available to the public through the NHGIS Data Finder, these datasets provide aggregated tables of statistics comparable across time, and for many scales of geographic area. For instance, the initial data release includes 100% population count data from every Decennial Census since 1790 at the state and county levels, while providing such data down to the Census tract and place levels for the 1970 through 2010 Decennial Censuses.

          Time series data can be viewed and downloaded in layouts differentiated either by file (one file for each time point of data, encompassing all geographic units) or by row (one file for all geographic units, with each time point occupying a row of data). Future data releases will not only provide column-differentiated time series data, but will also incorporate the American Community Survey datasets.

          The National Historical Geographic Information System is a free-of-charge and public-accessible service of the Minnesota Population Center, a demographic research center at the University of Minnesota.

          GIS in the Cloud Virtual Meeting – October 12, 2012 from 9-10:30am

          The Connecticut GIS User to User Network virtual meeting on GIS in the Cloud will be this Friday, Oct. 12, 9:00 AM- 10:30AM.  There will be three GIS cloud users presenting and two GIS cloud service providers.

          The meeting can be viewed live starting at 9:10am on October 12, 2012 at: http://youtu.be/F69upDZDyfQ


          A link to the webcast will also be included in this blog post at the start of the meeting. We will handle questions using ctgisu2un@gmail.com ,the Network’s e-mail account.

          If you cannot make the meeting a link to that video will be on the Network’s home page http://ctgis.uconn.edu/for later viewing.  
          Also, check out the two new Google Map web sites for the Connecticut GIS User to User Network:
          Map of Members: 
          To add yourself to the map!
          A map of town GIS status from a survey done by Meghan McGaffin (Milford) last year.

          Month in Review – CtSDC & MAGIC – September 2012

          Month in Review – CtSDC & MAGIC – September 2012

          The Connecticut State Data Center (CtSDC) and the University of Connecticut Libraries Map and Geographic Information Center (MAGIC) continue to expand upon our web resources to include more data, GIS datasets, interactive maps, historical maps, and aerial photography. During the month of September 2012, most web products experienced an increase in usage, when compared to the same time period one year prior, and the number of inquiries received continues to rise, including the amount of time devoted to each question. Included below are highlights from September 2012 which focuses on five main areas: User Inquiries, Web Content Views, Trends in Webpage Usage, Trends in Keywords, and Projects in Progress.


          I. User Inquiries

          Total User Inquiries
          Included below are the statistics for user inquiries received by phone, email, and in-person during September 2012. As the data clearly visualizes, the number of inquiries continues to rise with the year to date totals representing a 124% increase when compared to the January 1- September 30 of the previous year.


          Total Inquiries
          Monthly Change
          vs. 2011
          YTD Inquiries
          for 2012
          YTD Change
          vs. 2011
          Connecticut State Data Center
          210
          99%
          1,347
          100%
          MAGIC
          254
          116%
          1,360
          156%

          Total
          464
          149%
          2,707
          124%


          II. Web Content Views

          Total Unique Content Views
          Included below are the web content unique views statistics for September 2012 which include comparisons with September 2011, the year to date (YTD) unique views and the change in the total number of unique views when compared to the same time period (January 1 – September 30)  from the previous year.

          Web Resource
          Unique Views
          Monthly Change
          vs. 2011
          YTD Unique Views
          for 2012
          YTD Change
          vs. 2011
          Connecticut State Data Center
          1,570
          19%
          13,798
          14%
          MAGIC 2.0 Online Maps
          454
          -22%
          4,517
          -46%
          MAGIC  Flickr Collections
          36,648
          110%
          310,858
          59%
          MAGIC News Blog (Retired)
          37
          95%
          330
          28%
          MAGIC Website
          11,553
          -1%
          111,089
          12%
          Outside the Neatline Blog
          787
          -27%
          7,728
          12%

          Total*
          51,049
          59%
          448,334
          39%
          * Total includes CT View

          Total Content Views
          With more users viewing web content more than once from MAGIC and the Connecticut State Data Center, the total views of web content provides a more detailed view of the trends in usage. The following table includes the usage trends for the total number of views, monthly change when compared to same month in 2011, the year to date (YTD) total number of views and the change in total views when compared to the same time period (January 1 – September 30) from the previous year.

          Web Resource
          Total Views
          Monthly Change
          vs. 2011
          YTD Total Views
          for 2012
          YTD Change
          vs. 2011
          Connecticut State Data Center
          2,150
          9%
          20,113
          10%
          MAGIC 2.0 Online Maps
          4,051
          -19%
          38,421
          -53%
          MAGIC  Flickr Collections
          36,648
          110%
          310,858
          59%
          MAGIC News Blog (Retired)
          51
          132%
          468
          54%
          MAGIC Website
          17,497
          -3%
          173,749
          13%
          Outside the Neatline Blog
          1,128
          -25%
          10,583
          13%

          Total*
          61,525
          40%
          554,206
          21%
          * Total includes CT View

          III. Trends in Webpage Usage – September 2012
          Ever wondered what the most popular pages are at MAGIC and the Connecticut State Data Center? Included below are the top 5 most popular pages for September 2012.

          Most Popular pages – Connecticut State Data Center
          Page
          Total Views
          526
          514
          275
          224
          117

          Most Popular pages – MAGIC 
          Page
          Total Views
          3,619
           3,053
          1,087
          1,043
          853


          Most Popular pages – Outside the Neatline Blog 
          Page
          Total Views
          99
          Raster vs Vector         
               91
          83
          78
          58


          IV. Trends in Keywords – September 2012
          At the Connecticut State Data Center and MAGIC each month we analyze keyword searches conducted on our websites to determine areas to focus increasing accessing to maps, data, and resources. Keyword provide us with an opportunity to see trends, areas for improvement, and have been integral to providing guidance on website development and improvements. Included below are keyword trends for September 2012.

          Most Frequent Keywords – Connecticut State Data Center
          Keyword
          Weston, CT
          Suffield
            
          Most Frequent Keywords – MAGIC
          Keyword
          uconn map
          beers
          birds eye willimantic
          fairfield
          GIS Day

          V. Projects in Progress – September 2012
          Each month the students and staff at MAGIC and the Connecticut State Data Center are working on a series of projects, tasks, data sets, and resources which users typically don’t know about until we add the resource to our website. Included below is a list of projects that are currently underway which will be completed in the coming months and made available in their final forms via our websites.

          • Connecticut Population Projections 2015-2025 – Additional scripting and development for the upcoming release of the population projections for Connecticut at the State, County, Regional Planning Agency, and Town levels has prepared the projections for review. During the review phase of these projections, examination of the data provided an opportunity to revised the scripts to enable future updates as new data is provided, and the ability to provide custom cohorts (upon request) and multiple formats for the final data. The projections will be released in October 2012 and this project is still underway and the public is able to view a preliminary version (population estimates are subject to change and revised methodology will be utilized for the final release). View the preliminary projections and the interactive data interface at: http://ctsdc.uconn.edu/projections.html
          • Data Visualization – The Connecticut State Data Center has developed a series of data visualizations using Tableau Public. The visualizations include national, town, and census tract based examples which can be viewed at: http://ctsdc.uconn.edu/dataviz/
          • Slavery Ship Logs Mapping Project – MAGIC and the Connecticut State Library are collaborating to map out the ship logs from 1757-1758 between New London, CT and West Africa. This project involves transcribing the log books into a spreadsheet which can be used to create a map of the voyages. A few samples of the logs are available from the Connecticut State Library website at: http://www.cslib.org/slaverlog.htm
          • Bridgeport and Waterbury Historical Mapping Project – Two interns at MAGIC this semester are georeferencing scans of historic Sanborn Fire Insurance Maps from Yale University for Bridgeport and Waterbury. These maps will be used to help map out data from the 1920s census for Waterbury and to examine census data in Bridgeport.
          • ACS 2011 – 1 Year Estimates – Connecticut State Data Center is in the process of creating downloadable datasets for the 2011 ACS 1 Year estimates datasets. The datasets will include spreadsheet and geodatabase files for state, county, congressional districts, and the 8 largest towns in Connecticut and will be made available to the public once completed via the Connecticut State Data Center website at: http://ctsdc.uconn.edu/connecticut_census_data.html
          Have an idea for a project or suggestions for improvements to MAGIC and the Connecticut State Data Center’s website and web offerings? Leave us a comment or contact us at magic@uconn.edu.  


          Each month we will be posting a “Month in Review” article so check back next month to see the latest information on usage trends at MAGIC and the Connecticut State Data Center.


          Connecticut GeoFocus – Fall 2012 Issue

          The Connecticut GIS User to User Network and the Connecticut GIS Council Education and Outreach Working Group’s latest issue of GeoFocus, CT’s Quarterly Geospatial Newsletter is now available. Included below are just a few highlights from the Fall 2012 (September) issue:

          • New! EOC Web Viewer
          • Essay: GIS and Cartography
          • Greatest Paper Map of the US
          • 10 Tips on Making and Effective Poster
          • Mapping for Flood Mitigation
          • Letter from Thad Dymkowski – President of the Connecticut GIS User to User Network
          • And more!
          Check out the latest issue today!
          Interesting in contributing to CT GeoFocus?
          If you are interested in submitting articles for the next issue of GeoFocus, details are provided on page 1 of the newsletter.