Are Toxic Chemicals Being Released Near You?

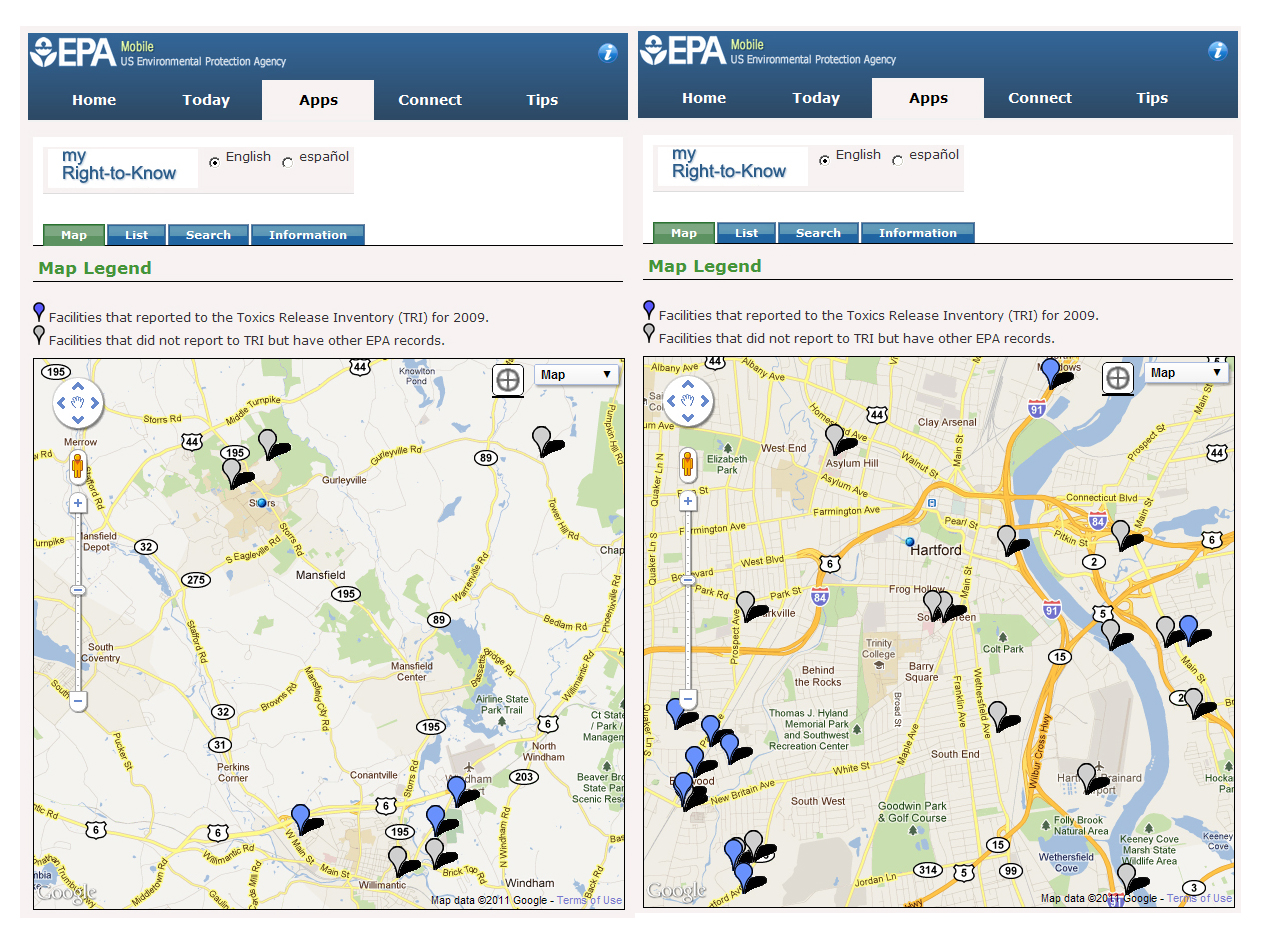
Screenshots from the EPA myRight-to-Know app that show facilities registered with the Toxic Release Inventory: the left image shows the Storrs-Willimantic, CT area while the image on the right displays the Hartford, CT area.
The EPA has created a web application related to the Toxic Release Inventory (TRI) Program. According to the myRight-to-Know website, the app “maps nearby facilities that report to TRI, as well as large permit holders in the Air, Water or Hazardous Waste programs that are expected to produce, manage or release TRI-reportable chemicals.”
The application uses an address search and the Google Maps basemap. When a user clicks on a facility that is displayed on the map, the user can access the facility’s report. For example:

Pratt & Whitney facility, which is located in East Hartford, has a report that shows it is ranked 207 out of 1,240 facilities nationwide in its industry (Transportation Equipment)- with 1 representing the highest amount of releases. The facility report also shows what chemicals are being released, how much is being released, where the releases are going (Air, Water, or Land), and the chemicals’ health effects. In the case of this Pratt & Whitney facility’s report, the vast majority of its releases go into the air and include the carcinogens Nickel and Cobalt

The myRight-to-Know app is also available en Español.


Poverty Among Latino Children At An All-Time High

According to a Pew Hispanic Center report, poverty among children in the U.S. is now highest in the Latino population.

According to a recent report from the Pew Hispanic Center, poverty among Latino children is at an all time high and, for the first time, has displaced White children as the single largest group of children in poverty:


More Latino children are living in poverty—6.1 million in 2010—than children of any other racial or ethnic group. This marks the first time in U.S. history that the single largest group of poor children is not white. In 2010, 37.3% of poor children were Latino, 30.5% were white and 26.6% were black.”


Also according to the report, while about two-thirds of the children’s parents immigrated to the United States, an overwhelming majority (86%) of the children were born in America. It seems that this increase, both relative and absolute, is another impact of the Great Recession:


“Prior to the Great Recession, more white children lived in poverty than Hispanic children. However, since 2007, that pattern has reversed. Between 2007 and 2010, an additional 1.6 million Hispanic children lived in poverty, an increase of 36.3%. By contrast, even though the number of white and black children living in poverty also grew, their numbers grew more slowly—up 17.6% and 11.7% respectively.”


Experimental Poverty Measures Public Use Research File and Release of Supplemental Poverty Measure Research

The Census Bureau has released a microdata file that permits users to create tables updating the National Academy of Sciences’ experimental poverty estimates. This file will permit users to construct 2010 estimates. These estimates are different from the supplemental poverty measure, which is the topic for a Nov. 4 technical webinar. On Nov. 7, at a Brookings Institution seminar, the Census Bureau will release a supplemental poverty measure that complements, but does not replace, the official measure. This measure is the product of years of research and collaboration with other organizations, such as the National Academy of Sciences and the Bureau of Labor Statistics. A Census Bureau subject-matter expert will discuss supplemental poverty measure results and methodology at the seminar. 


The microdata released on October 27, 2011 are available at: http://www.census.gov/hhes/povmeas/data/public-use.html.

Demographic Resources from Cornell University

The Cornell University Program on Applied Demographics (PAD) website possesses some great Census related resources. The first is a margin of error calculator for American Community Survey data which was created based on this U.S. Census Bureau document. The calculator allows you to enter values and operations in order to compute new margins of errors or test for significance of the difference between values.

Second, if you are looking for maps of current demographic data for the state of New York, then this site’s Census 2010 Atlas will be especially helpful. It has an easy to use index that allows users to choose what map to display. Once the map is displayed you can easily download a professionally prepared map in the form of a JPEG file.


The PAD website also has additional resources including white papers, presentations and more.

Webinar – Using CLEAR Web Tools for Local Conservation Planning

The University of Connecticut’s Center for Land Use Education and Research (CLEAR) is holding the last webinar of their 2011 series on Tuesday, November 8. The webinar will discuss CLEAR’s free web mapping tools for local conservation planning. It is geared toward users with limited desktop GIS experience. Check out the full description and registration link below.
Using CLEAR Web Tools for Local Conservation Planning
DATE:     Tuesday November 8, 2011
TIME:       2:00 – 3:00 PM
COST:     As always, it’s FREE!
Local land trusts and conservation commissions are major players in land conservation in Connecticut, yet few have direct access to technical resources that can help them in their task of permanently protecting open space. In many cases, web-based information and tools created by the UConn Center for Land Use Education and Research (CLEAR) and its partners can help. These websites can be used by anyone — no geospatial expertise needed!
This presentation will use live online demonstration of these tools to show how they can be used to get a handle on state and local land use trends, and help analyze conservation opportunities. The “tour” will include examples using the Connecticut’s Changing Landscape website, the CT-ECO online mapping site, and other exciting destinations.  We will leave ample time for questions from the audience.

Cravify Maps Occupy Wall Street Tweets

Cravify features an interactive map of tweets related to the Occupy Wall Street demonstrations.

Cravify, a location based classified ads search engine, has developed a map of tweets related to the Occupy Wall Street movement. Similar to the map developed by ESRI, this map aggregates tweets related to the demonstrations and displays them over an easy to navigate basemap which, in the case Cravify, is Google Maps. Follow this link for more on Cravify or follow the developers on Twitter (@Trung_cravify and @humphrey_f).

An Update on ESRI’s Occupy Wall Street Map

The ESRI Occupy Wall Street map now displays locations of demonstrations.

A little over a week ago, I posted the ESRI produced Occupy Wall Street map. One of the items I noted was how the content was mostly limited to the occupation in Manhattan. Just over ten days later, the capabilities of this map have been expanded and the amount of content has grown exponentially. In addition to YouTube videos, Tweets, and images from Flickr, the OWS map now displays Occupy locations (which span the entire globe – see screenshot above) and a tool that allows users to quickly zoom to different cities located under the Areas of Interests button.

2010 Guide to State and Local Census Geography

Ever wanted to know what the historical center for population in a state based on decennial census data? Check out the 2010 Guide to State and Local Census Geography includes a quick summary of 2010 Census data based on geography. Check out these reports at: http://www.census.gov/geo/www/guidestloc/guide_main.html

Below is a quick example of some of the data available for Connecticut

CONNECTICUT CENTERS OF POPULATION

http://www.census.gov/geo/www/2010census/centerpop2010/historical/historical_cenpop_09.html

Year North Latitude West Longitude
20106 41° 29′ 49″ 72° 52′ 13″
20006 41° 29′ 41″ 72° 52′ 28″
19905 41° 29′ 49″ 72° 52′ 10″
19804 41° 29′ 26″ 72° 52′ 34″
19703 41° 29′ 17″ 72° 52′ 38″
19603 41° 32′ 11″ 72° 53′ 00″
19503 41° 30′ 33″ 72° 52′ 57″
19402 41° 32′ 12″ 72° 53′ 29″
19302 41° 32′ 11″ 72° 53′ 22″
19201 41° 30′ 08″ 72° 51′ 47″
19101 41° 30′ 54″ 72° 50′ 20″
19001 41° 31′ 23″ 72° 49′ 06″
18901 41° 31′ 41″ 72° 48′ 00″
18801 41° 32′ 49″ 72° 46′ 21″
1  Source:  U.S. Department of Commerce, Bureau of the Census, Fourteenth Census of the United States, 1923
2  Source:  U.S. Census Bureau, recomputation for historical county level data which relied upon aggregate county level population data with an estimated county centroid resulting in a possible error of up to one mile.
3  Source:  U.S. Department of Commerce, Bureau of the Census, Centers of Population for States and Counties, 1974
4  Source:  U.S. Census Bureau, Geography Division, recomputation from archived national block group/enumeration area data resulting in a possible error of up to 1,000 feet.
5  Source:  U.S. Census Bureau, Geography Division, recomputation from archived national block group data resulting in a possible error of up to 1,000 feet.
6  Source:  U.S. Census Bureau, computation from national block-level data