Redesigned Census.gov website now available

Do you use the U.S. Census website and have had difficulties locating data and resources? If so then be sure to check out the newly redesigned census.gov website which has greatly improved access to data, maps, and statistics from the U.S. Census Bureau! 
As the first step to making Census content more accessible, useful, and interesting for our users today the U.S. Census Bureau has redesigned Census.gov.  The goal of this redesign is to make it easier for users to find information and to increase public awareness of how the Census measures people, places, and the economy.
Here are some of the new features and tools users will experience:
  • A prominent dashboard showing off the Census Bureau’s economic indicators
  • A top dropdown menu for quick navigation to key topics
  • A new interactive map showing a mash up of economic and demographic statistics
  • A “Stat of the Day” highlighting Census Bureau statistics across all the data we collect
  • A mega footer with links categorized under familiar topics and highly trafficked pages
  • A feature for users to provide feedback

As the U.S. Census Bureau continues to transform census.gov, the public will gain greater accessibility to U.S. Census Bureau statistics through both their desktops and mobile devices. Users will see additional improvements in search, topic-based navigation, visualizations and digital content. 

Connecticut GeoFocus Winter Edition

The latest issue of the Connecticut GeoFocus newsletter is now available and includes the following topics: 


To view this issue visit:

A Look at Childcare arrangements, LIVE on CSPAN’s “Washington Journal” on 12/23/2011 at 9:15am

On Friday, Dec. 23, from 9:15 a.m. to 10 a.m, Lynda Laughlin, family demographer, US. Census Bureau’s Fertility and Family Statistics Branch, will appear live on C-SPAN’s “Washington Journal” to discuss child care arrangements in the 21st century.  Her presentation will include a rich mix of statistical visualizations and discussion, including a public call-in segment.  This part of a weekly Friday series called “America By the Numbers” that features the federal statistical agencies.


You are invited to tune in and watch the program.  C-SPAN is available live through the Internet at http://www.c-span.org/Series/Washington-Journal/.


For more information and to view the presentation graphs, please visit the following link, which will be live Friday morning (Dec 23, 2011): http://www.census.gov/newsroom/cspan/childcare.html

Brookings Maps Economic Recovery

Yesterday, The Brookings Institution, a Washington, D.C. based nonprofit policy organization, released a report that classifies the economic recovery of the 100 largest metropolitan areas in the country through the third quarter of 2011. The report classified each metro area into 5 categories based on four indicators: employment change, unemployment rate change, gross metropolitan product change, and housing price index change. The full list of metro areas with their classification is available here, but Brookings has also created a very cool interactive map, which is symbolized by economic recovery. Additionally, clicking on one of the map’s metro areas reveals an economic recovery report for the respective metro area.

According to the report, the strongest 20 metros are:

  • Albuquerque, NM 
  • Bakersfield, CA
  • Boston-Cambridge-Quincy, MA-NH
  • Dallas-Fort Worth-Arlington, TX 
  • Des Moines-West Des Moines, IA 
  • Detroit-Warren-Livonia, MI 
  • Grand Rapids-Wyoming, MI 
  • Houston-Sugar Land-Baytown, TX
  • Lakeland-Winter Haven, FL 
  • McAllen-Edinburg-Mission, TX
  • New Orleans-Metairie-Kenner, LA 
  • North Port-Bradenton-Sarasota, FL 
  • Ogden-Clearfield, UT 
  • Phoenix-Mesa-Glendale, AZ 
  • Provo-Orem, UT 
  • Rochester, NY 
  • San Jose-Sunnyvale-Santa Clara, CA 
  • Toledo, OH 
  • Worcester, MA 
  • Youngstown-Warren-Boardman, OH-PA 

Bring Geography With You When Travelling!

Many of us will be traveling this holiday season to visit family and friends and this might involve some long car, train or plane trips.  To pass the time I propose bringing some geography with you as you travel!  How is this possible?  With podcasts of course!  Here are some blog and podcasts sites that you can download as mp3’s for your trip.

Geography or (geo related) Podcasts:

Search for more at the link below:
More Free Podcasts at Online Education Database

Mother Jones Maps U.S. Crime Exonerations

A new map from Mother Jones (pictured above) depicts 825 known crime exonerations in the United States since 1989. Clicking a state on the map allows you to find out specific information including the number of exonerations during this time period in the respective state as well as whether or not the exonerations were based on DNA evidence. For example, in Connecticut, the map indicates there have been 7 verified exonerations since 1989, 4 of which came via DNA evidence and 3 of them via non-DNA evidence. In addition, the map label indicates that Connecticut has a Compensation Law. The map also indicates the states where posthumous exonerations have occurred. Visit the Mother Jones article for more.

The Impact of High Speed Rail on Accessibility in China

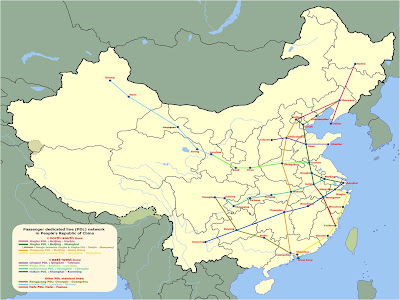
The planned National High Speed Rail Network in the People’s Republic of China.

Jie Lin, who is a colleague of mine both at the CtSDC and the Department of Geography Ph.D. program, recently examined the impacts of the planned High Speed Rail Network in the People’s Republic of China. Specifically, Jie’s focus has been on the increase in accessibility that would be a result of implementing the planned high speed network. Before we dive into Jie’s results, however,  a little background.

The total area of China is comparable to the size of the United States and the majority of that land is continuous. China has varying local physical geography that can isolate places- like the mountainous region of Tibet. Consequently, the successful implementation of a transportation network with higher travel speeds and greater accessibility has consequences in the realms of culture, the economy, and the overall social fabric of the country. Greater accessibility means the spatiotemporal size of the country decreases (ie. it takes a shorter amount of time to go from A to B, thus making A and B “closer”).

But, how does one calculate accessibility? Accessibility is defined by the ease of getting from place to place in a network. It is commonly calculated using a connectivity matrix like this:

This matrix is formed by counting how many nodes one must pass through in order to get to another node in the matrix. For example, the shortest way to go from A to E, is to pass through B, C, and E, so a 3 is added to Row A, Column E. The only difference in Jie’s study is that the calculations are not based on how many nodes one must pass through, but rather the time (in hours) it takes via the shortest route. As you can see, this measure evaluates your ability to travel from each node to each and every other node in the network.
Jie’s study, which included 31 provincial capitals and administered municipalities, was based on the following assumptions:
  • Speed of Normal Rail: 130 km/h
  • Speed of High Speed Rail: 280 km/h
Now, to Jie’s results. The units, besides the percentage column, are in hours:
And, for those of you (like me) who prefer to communicate visually, here is the resulting map. Again, units are in hours:
One of the most interesting points that I discussed with Jie is that although there are no plans for the Tibetan Region to be served by high speed rail (it is served by normal rail), the accessibility of the city of Lhasa is increased tremendously due to the improvements in other parts of the network. In fact, Lhasa has the greatest absolute change in accessibility out of any city in the study. It will be interesting to see this will affect the region culturally, economically, and socially. Overall, Jie found that the full implementation of this high speed rail network would mean an average increase in accessibility of about 50% for the cities included in the study.

TypeBrewer – Visualize Typography Before Committing

Visualize your typography for your cartographic representation before you begin and save yourself time!

TypeBrewer.org

 TypeBrewer.org presents an interactive mapping interface that allows a user to play with font types, character spacing, and density of labels before even beginning their map in their chosen software.  After selecting the style that suits the author of the map, you can download a template for graphic design software or create a style specification sheet to use as a reference in a GIS platform.

If you crave more information about cartographic representation check out Semiology of Graphics by Jacques Bertin, available from ESRI Press.

The Holiday Season in Numbers

Here are some statistics from the U.S. Census Bureau for the holiday season:

$27.2 Billion – Value of retail sales in the nation’s department stores in December 2010

$34 Billion – Value of retail sales via electronic shopping and mail-order houses in December 2010

$983 Million – Value of U.S. imports of Christmas tree ornaments from China between January and September 2011

$2.5 Billion – The value of U.S. toy imports including stuffed toys, puzzles, and electric trains from China between January and September 2011.

50% – Proportion of nations potatoes produced in Idaho and Washington in 2010

$1.5 Billion – Value of product shipments of candles in 2009 by the nation’s manufacturers

Happy Holidays!


U.S. Census Bureau: More Families with Children Receive TANF During 2009 Recession

The U.S. Census reports that families with children in the Temporary Assistance to Needy Families (TANF) increased from 3.8% in 2006 to 4.8% in 2009. TANF, a federal welfare program, was examined in a report entitled Comparing Program Participation of TANF and non-TANF Families Before and During a Time of Recession. The report’s authors also imply that the impact of the Great Recession has not been limited to TANF and poor families. Click here to visit the U.S. Census Bureau’s press released about this report.