*UNOFFICIAL* Election 2012 Connecticut Results – MAGIC/CtSDC Visualizations


*UPDATED AT 3:04PM, NOVEMBER 12, 2012*

These are the unofficial election results for the Presidential, U.S. Senate, and U.S. Congressional races for the State of Connecticut. The results will be released on an incremental town-by-town basis, beginning after polls close at 8pm. These results are first made available by the Office of the Secretary of the State, as they are received, through their Statement of Vote website. From there, the Connecticut State Data Center will update the below maps.

The data presented here are solely the responsibility of the Connecticut State Data Center, and should not be taken as the official results of the 2012 elections. Any errors in the results as they are presented here are not a fault of the Office of the Secretary of the State.

For each of the races presented below, only the results of the two major party candidates are provided at this time. This is an experimental attempt at providing timely data via the Web, but it is still being processed manually, so the data available are limited for the sake of expediency in returning results. Geographic visualizations for the full and official results will be made available in the coming weeks. In the meantime, we would appreciate feedback on your experience with this interface.

Presidential Race 2012

Barack Obama – Joe Biden (D-Blue)
Mitt Romney – Paul Ryan (R-Red)

Senate Election 2012

Chris Murphy (D-Blue)
Linda McMahon (R-Red)

1st Congressional District Election 2012

John Larson (D-Blue)
John Decker (R-Red)

2nd Congressional District Election 2012

Joe Courtney (D-Blue)
Paul Formica (R-Red)


3rd Congressional District Election 2012

Rosa DeLauro (D-Blue)
Wayne Winsley (R-Red)


4th Congressional District Election 2012

Jim Himes (D-Blue)
Steve Obsitnik (R-Red)


5th Congressional District Election 2012

Elizabeth Esty (D-Blue)
Andrew Roraback (R-Red)


2012 Connecticut Elections

Connecticut polls are open for the 2012 election from 6:00 AM to 8:00 PM tomorrow. Voters in the state will be casting ballots deciding the next President of the United States, one of our two U.S. Senators, Representatives for our five Congressional Districts, along with state senators and assembly members, a number of other local offices, and on a variety of ballot measures at the town level.

For the more than 2.1 million Connecticut residents registered to vote, get a glimpse ahead of time on the full contents of the ballot you will encounter tomorrow through the Connecticut Secretary of the State (SOTS) website, selecting your town.

Tomorrow night, election results will be reported to the public through two systems of communication. First, through the SOTS Statement of Vote website, the public can access unofficial results as they are updated by the towns to the Department throughout the evening. In the coming weeks after the election, this site will also provide access to the official election results. A second reporting structure is also being partially implemented for this election, with plans for a wider implementation in future elections. The CT SOTS Election Night Reporting Election Center will provide unofficial results for Connecticut towns (that have elected to participate in this election) as the towns themselves report their districts’ results.

In two Connecticut voting districts, Bridgeport and New London, the Secretary of the State has announced that their polling places have changed due to the lingering flooding impact of Hurricane Sandy.

  • In Bridgeport, Longfellow School voters will go to Aquaculture School, 60 St. Stephens Rd, Bridgeport, CT 06605
  • In New London, Ocean Beach voters will go to Harbor School, 432 Montauk Ave, New London, CT 06320

For all other Connecticut voters, look up your registration status and polling location through the SOTS website here.

Visualizing the 2012 Presidential Election

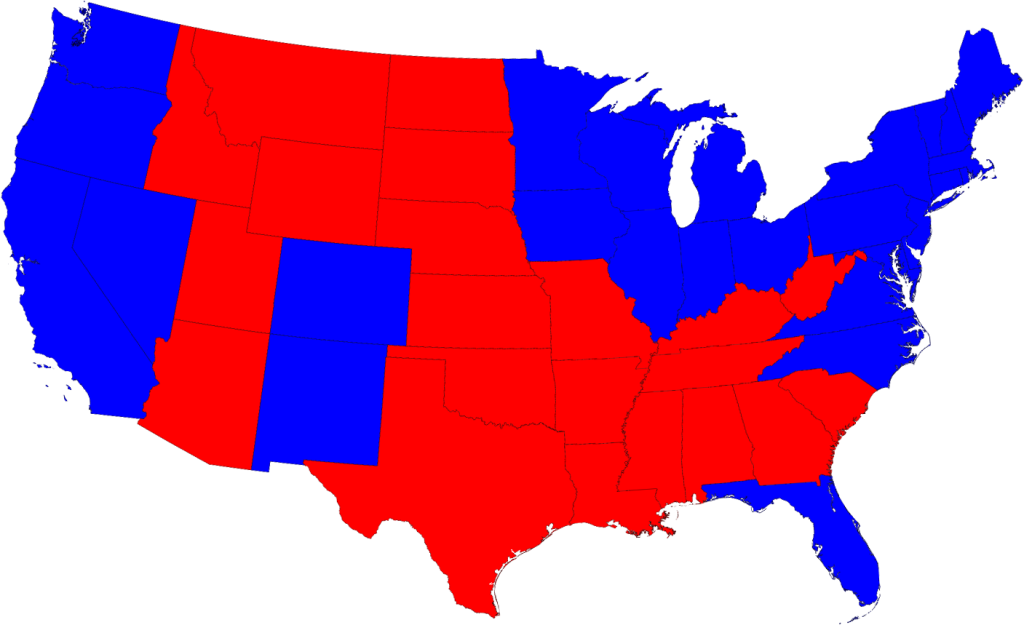
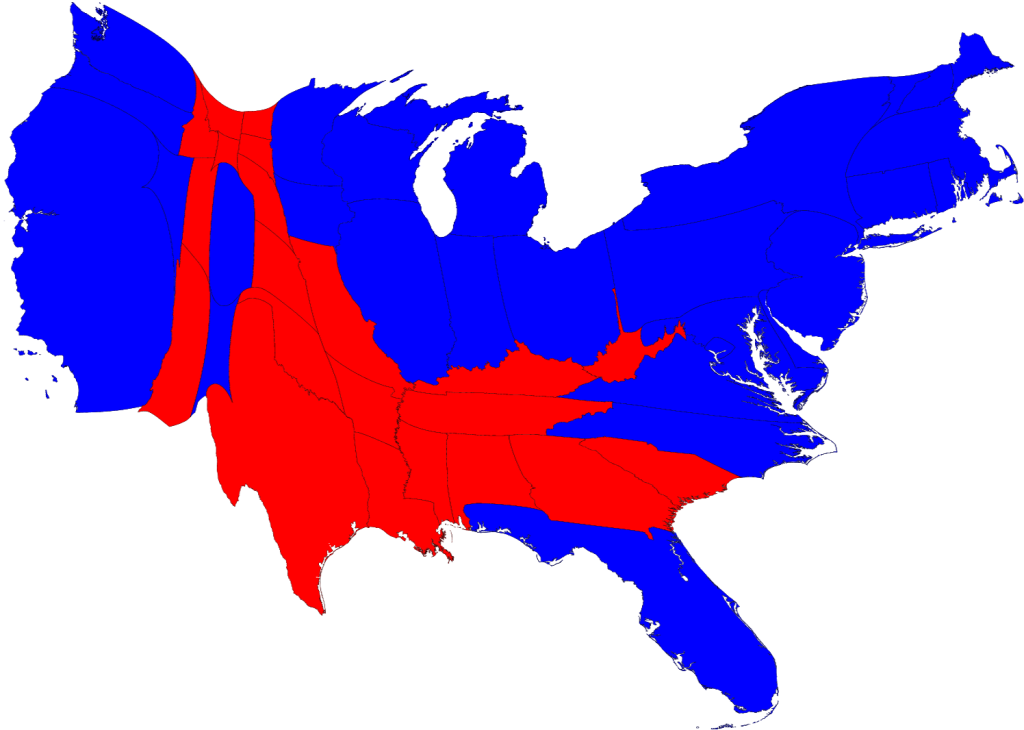
The 2012 Election is only four days away. How we make sense of the information available to us can be daunting, but can also be visually appealing. Consider first the popularity of the cartograms of the 2008 presidential election results, produced by Dr. Mark Newman of the University of Michigan. For many people, these maps evolved their understanding of effect of the distribution of the U.S. population on election results.


Polling and the Electoral College

We are well into the realm of real-time information analysis and visualization in the 2012 election. For major news sources, especially, the Internet provides an ideal outlet for up-to-the-nanosecond updates on the proverbial reams of data in the air about the current status of the election. Prior to the election, multiple polls of likely voters, along with other demographic analyses, are often combined into models that seek to predict the outcome of the electoral college. These models are well-suited to geographical visualizations, the maps of so-called ‘red states’ and ‘blue states’ (for the Republican Party and Democratic Party majority popular votes, respectively, that determine to which presidential candidate each state’s electoral college votes will be allotted).

Source: NBCConnecticut.com

The amount and variety of data now available, however, offers the opportunity for users to explore deeply into the fervent ongoing analysis in these final days leading up to the election. On the websites of many news and media outlets, users can examine the upcoming election by race (President, Senate, House, Governor), by geography (in your state and sometimes at the county level), or by polling organization. Direct links to information sources are usually available, as are the means for sharing such information through social networks. Listed below are several of the more prominent sites for exploring the 2012 election in more detail.

  • The New York Times provides an example of a relatively simpler visualization, through a standard map view, a cartogram – where the size of each state is weighted by the number of electoral votes (see below for other examples of election cartograms) – along with other groupings of possible outcomes. They also have maps of the Senate and House of Representatives races.
  • On the Washington Post, the presidential election can be explored further with maps available at both state and county levels. At the this closer level of detail, users can also examine the Post’s electoral vote projections in relation to a number of social, economic and demographic characteristics, with unemployment, income, and race/ethnicity among them. Visualizations are also available for races in the Senate, the House, and for governor.
  • At the Wall Street Journal, their election site has provided a set of visualizations similar to the Washington Post – at the state and county level, and for the Senate, House, and governor races. More interesting is their inclusion of ‘Community Type’ data at the county level, a classification system from the Patchwork Nation project of the Jefferson Institute. Based on socioeconomic and demographic statistics, the Journal visualizes U.S. counties in categories such as “Monied ‘Burbs”, “Tractor Country”, “Immigration Nation”, and “Emptying Nests”.
  • The Huffington Post aggregates a large number of opinion polls into a predictive model, providing an up-to-date outlook on the election. Users are able to go in-depth with their sources, looking at changes in the model over time and for each state. In addition, the elegance of their House of Representatives visualization is an appealing and intuitive look at the current House in comparison with projected election results.
Source: HuffingtonPost.com

  • Real Clear Politics provides a quantitatively-dense site of information on their electoral college predictions and current polling projections for the presidential and congressional races.
  • Lastly, at 270 to Win, the current election is placed in the context of all presidential election results throughout U.S. history. In 1789, George Washington won the election with 69 electoral votes, in comparison to the 34 electoral votes of John Adams.

Interactive Electoral College Predictions

A very popular and prominent feature on many election websites for the 2012 presidential election is an interactive visualization of user-selected electoral college results. Anyone can create a whole range of maps for both the plausible (and implausible) scenarios of how the electoral college will vote. The electoral college vote is a fascinating aspect

One fascinating example is VoteNight.com, embedded below. By clicking on each state multiple times, the user can change the electoral results from Obama/Biden, to Romney/Ryan, to undecided. The application automatically re-tallies the results based upon the user’s changes. More interesting, however, is the ability to examine presidential election results from previous elections – as far back as the 1932 race between incumbent Herbert Hoover and eventual winner Franklin Roosevelt – and to then predict the results of the 2012 election based upon those historical results.

The degree of reality and amount of interactivity vary between the many choices, however. An interesting way to test this is to find out which are the only two states in the Union that “split” their electoral votes between the popular election results and the Congressional district election results. (Hint: it isn’t Connecticut.)

  • On PBS NewsHour’s Vote 2012, you can choose to predict the current election results with your own selections, or visualize the result of the Obama-Romney contest based upon the outcomes of prior elections, going as far back as 1964. 
  • Politico.com only allows swing state results to be manipulated.
  • The New York Times provides their non-mapped version under the heading “Make Your Own Scenarios.
  • On the Huffington Post, as with PBS, you can base predicted results on the 2008, 2000, 1980, 1960, and 1880 presidential elections.
  • At Real Clear Politics, results can likewise be predicted from previous election results since 1972. Uniquely, though, states can be changed to the degree of predicted result, as being “solid”, “likely”, “leans” for one or the other candiate.
  • Even the federal government is in this game! At the U.S. National Archives, predictions can be based on the 2008 and 2004 elections.
Check with Outside the Neatline again in the coming days and weeks for more information on the 2012 Election, in Connecticut and across the country.

Month in Review – CtSDC & MAGIC – October 2012

Month in Review – CtSDC & MAGIC – October 2012

The Connecticut State Data Center (CtSDC) and the University of Connecticut Libraries Map and Geographic Information Center (MAGIC) continue to expand upon our web resources to include more data, GIS datasets, interactive maps, historical maps, and aerial photography. During the month of October 2012, most web products experienced an increase in usage, when compared to the same time period one year prior, and the number of inquiries received continues to rise, including the amount of time devoted to each question. Included below are highlights from October 2012 which focuses on five main areas: User Inquiries, Web Content Views, Trends in Webpage Usage, Trends in Keywords, and Projects in Progress.


I. User Inquiries

Total User Inquiries
Included below are the statistics for user inquiries received by phone, email, and in-person during October 2012. As the data clearly visualizes, the number of inquiries continues to rise with the year to date totals representing a 129% increase when compared to the January 1- October 31 of the previous year.


Total Inquiries
Monthly Change
vs. 2011
YTD Inquiries
for 2012
YTD Change
vs. 2011
Connecticut State Data Center
179
90%
1,702
98%
MAGIC
342
213%
1,526
165%

Total
521
157%
3,228
129%


II. Web Content Views

Total Unique Content Views
Included below are the web content unique views statistics for October 2012 which include comparisons with October 2011, the year to date (YTD) unique views and the change in the total number of unique views when compared to the same time period (January 1 – October 31)  from the previous year.

Web Resource
Unique Views
Monthly Change
vs. 2011
YTD Unique Views
for 2012
YTD Change
vs. 2011
Connecticut State Data Center
1,723
23%
15,521
15%
MAGIC 2.0 Online Maps
483
-18%
5,000
-44%
MAGIC  Flickr Collections
21,988
51%
332,846
59%
MAGIC News Blog (Retired)
40
54%
370
31%
MAGIC Website
15,899
34%
126,998
15%
Outside the Neatline Blog
1,606
-13%
9,334
12%

Total*
41,739
40%
490,073
39%
* Total includes CT View

Total Content Views
With more users viewing web content more than once from MAGIC and the Connecticut State Data Center, the total views of web content provides a more detailed view of the trends in usage. The following table includes the usage trends for the total number of views, monthly change when compared to same month in 2011, the year to date (YTD) total number of views and the change in total views when compared to the same time period (January 1 – October 31) from the previous year.

Web Resource
Total Views
Monthly Change
vs. 2011
YTD Total Views
for 2012
YTD Change
vs. 2011
Connecticut State Data Center
2,330
11%
22,443
10%
MAGIC 2.0 Online Maps
4,130
-32%
42,551
-51%
MAGIC  Flickr Collections
21,988
51%
332,846
59%
MAGIC News Blog (Retired)
66
83%
534
58%
MAGIC Website
23,351
25%
197,100
14%
Outside the Neatline Blog
2,139
18%
12,722
13%

Total*
54,004
25%
608,210
21%
* Total includes CT View

III. Trends in Webpage Usage – October 2012
Ever wondered what the most popular pages are at MAGIC and the Connecticut State Data Center? Included below are the top 5 most popular pages for October 2012.

Most Popular pages – Connecticut State Data Center
Page
Total Views
623
600
292
179
107

Most Popular pages – MAGIC 
Page
Total Views
4,171
 3,708
3,183
1,216
1,087


Most Popular pages – Outside the Neatline Blog 
Page
Total Views
509
Raster vs Vector         
     214
114
99
82


IV. Trends in Keywords – October 2012
At the Connecticut State Data Center and MAGIC each month we analyze keyword searches conducted on our websites to determine areas to focus increasing accessing to maps, data, and resources. Keyword provide us with an opportunity to see trends, areas for improvement, and have been integral to providing guidance on website development and improvements. Included below are keyword trends for October 2012.

Most Frequent Keywords – Connecticut State Data Center
Keyword
East Hartford
  
Most Frequent Keywords – MAGIC
Keyword
Stratford
land use
Bridgeport
campus map
Colchester Connecticut

V. Projects in Progress – October 2012
Each month the students and staff at MAGIC and the Connecticut State Data Center are working on a series of projects, tasks, data sets, and resources which users typically don’t know about until we add the resource to our website. Included below is a list of projects that are currently underway which will be completed in the coming months and made available in their final forms via our websites.

  • Connecticut Population Projections 2015-2025 – The population projections were completed during the month of October and are being released on November 1, 2012 to include data visualizations, downloadable datasets, in-depth methodology description, and a summary report are being created for individual towns which will be added to the site in the coming months.View the preliminary projections and the interactive data interface at: http://ctsdc.uconn.edu/projections.html
  • Data Visualization – The Connecticut State Data Center has added additional data visualizations which include census tract, town, regional planning organization, and other geographies to visualize census data from the American Community Survey (ACS). View the latest visualizations at: http://ctsdc.uconn.edu/dataviz/
  • 2012 Aerial Photography for Connecticut – We are in the process of receiving the 2012 Aerial Photography for Connecticut and in the coming months this data will be made available via MAGIC and CT ECO. Once all the data is received, a downloadable index of aerial photography images will be included on MAGIC’s website and a map service will be added to CT ECO thanks to the efforts of the CT DEEP and CLEAR.
  • Slavery Ship Logs Mapping Project – Work continues on trascribing ship logs from 1757-1758 as part of a collaborative project between MAGIC and the Connecticut State Library. This project involves transcribing the log books into a spreadsheet which can be used to create a map of the voyages. A few samples of the logs are available from the Connecticut State Library website at: http://www.cslib.org/slaverlog.htm
  • Bridgeport and Waterbury Historical Mapping Project – Two interns at MAGIC this semester are in the process of georeferencing scans of historic Sanborn Fire Insurance Maps from Yale University for Bridgeport and Waterbury. These maps will be used to help map out data from the 1920s census for Waterbury and to examine census data in Bridgeport. Samples of the Bridgeport project are included on a poster which is on display at the Legislative Office Building in Hartford, CT for Geography Awarness Month/GIS Day.
  • ACS 2011 – 1 Year Estimates – Connecticut State Data Center has processed and added downloadable data for the 2011 ACS 1 Year estimates datasets. The datasets will include spreadsheet, codebooks, and geodatabase files for state, county, congressional districts, unified school districts, and the 8 largest towns in Connecticut and are available for download from the Connecticut State Data Center website at: http://ctsdc.uconn.edu/connecticut_census_data.html
  • ACS 2011 – 3 Year Estimates – Connecticut State Data Center is in the process of creating downloadable datasets for the 2011 ACS 3 Year estimates datasets. The datasets will include spreadsheet and geodatabase files for state, county, congressional districts, and the 54 largest towns in Connecticut and will be made available to the public once completed via the Connecticut State Data Center website at: http://ctsdc.uconn.edu/connecticut_census_data.html
  • Connecticut State Data Center website enhancements – This past month the Connecticut Census Data page (http://ctsdc.uconn.edu/connecticut_census_data.html) was revised to include direct links to the Data Codebooks for the American Community Survey (ACS) and Decennial Census data. This enables users to quickly determine which table includes the data they need while also enabling both spreadsheet and geodatabase users to have quick access to the complete listing of data and tables available for download for Connecticut.
Have an idea for a project or suggestions for improvements to MAGIC and the Connecticut State Data Center’s website and web offerings? Leave us a comment or contact us at magic@uconn.edu.  


Each month we will be posting a “Month in Review” article so check back next month to see the latest information on usage trends at MAGIC and the Connecticut State Data Center.