Modeling the Elevation of Martha’s Vineyard in ArcGIS

This year, my graduate research in the UConn Department of Geography has focused on the vulnerability of Martha’s Vineyard to climate-related hazards like sea level rise and hurricanes. Using ArcGIS’ 3D Analyst, I have created a triangulated irregular network (TIN) to visualize elevation, which you can see above. I generated this model from contour lines (3 meter intervals), which I downloaded from MassGIS. Those of you familiar with the island will notice that this data, from 2005, does not show the breach of Norton Point Beach, which occurred most recently in 2007. For climate related happenings in the Cape Cod and Islands region, check out Climatide- a blog from the Cape and Islands NPR station (WCAI) and authored by Dr. Heather Goldstone.

Special Tabulation Based on Supplemental Poverty Measure Update

In a follow-up to the release of the supplemental poverty measure report, the New York Times commissioned the Census Bureau to create a special tabulation based on the measure, and as a service to other users we are posting this tabulation online. The statistics focus on the characteristics of the population just above the poverty line (100 to 150 percent of the poverty threshold). The supplemental poverty measure does not replace the official poverty measure but is intended to better reflect contemporary social and economic realities and government policy effects and thus provide a further understanding of economic conditions and trends. Internet address:
http://www.census.gov/hhes/povmeas/methodology/supplemental/research.html.

Special supplemental poverty measure tabulation: 
http://www.census.gov/newsroom/releases/pdf/CB11-TPS.51SpecTab.pdf [PDF]
Supplemental poverty measure report: 
http://www.census.gov/newsroom/releases/archives/news_conferences/2011-11-04_spm_webinar.html.
Official poverty measure: 
http://www.census.gov/newsroom/releases/archives/income_wealth/cb11-157.html.

Tracking Migration Patterns in the U.S.

Migration patterns of Tolland County, CT from this Forbes interactive map.

Are you interested in migration patterns in the U.S.? If so, check out this interactive map from Forbes, which is based on IRS data. The map details in and out migration by county. As an example, see the screenshot above of Tolland County, CT. It shows that between 2005-2009, 7,400 people migrated to Tolland County while 3,700 migrated away from Tolland County. The map also allows you to track where the in-migrants are coming from and where the out-migrants are going.

Mercury Hotspots

In the U.S., Mercury, which is toxic to brain development, is commonly emitted into the atmosphere.

Do you live near a Mercury Hotspot? I originally saw this map, which is based on a recent report from Environmental America, on Mother Jones. Although Mercury is toxic to us (it negatively affects brain development), it is commonly emitted into the air by industry. In the United States, 2/3 of the emissions are from coal fired power plants alone.

For more on locating pollution in the U.S., check out our other posts:
NPR and the Center for Public Integrity Investigate Poisoned Places of the U.S.
Are Toxic Chemicals Being Released Near You?

Join us at Connecticut GIS Day – November 17 @ 9:45am

There’s still time to join us at Connecticut’s GIS Day events being held today (November 17, 2011) at the Legislative Office Building in Hartford (300 Capitol Ave, Hartford, CT). Included below are details on this free event.

Connecticut GIS Day Schedule of Events – November 17, 2011

This year, the poster gallery includes 60 maps which are proudly displayed in the concourse of the State Legislative Office Building. Included below is the schedule of events for Connecticut’s GIS Day:

9:45 – Opening remarks and welcome
10:00 – ESRI – “Wizardry of the Flex Viewer in ArcGIS Server 10”
10:30 – Town of Milford – “Using a map when the lights go out – GIS and Storm Recovery”
11:00 – DEEP – “Highlighting GIS applications for Coastal and Environmental Management”
11:30 – USGS – “USGS Products for Large Scale Emergencies”
12:00 – LUNCH
1:00 – Connecticut State Data Center – “The numbers are in: 2010 Census for Connecticut”
1:30 – Connecticut Dept. of Agriculture – “Using GIS for shellfish resource management”
2:00 – HIFLD – “Hurricane Irene: Making sense of the remote sensing effort”
2:30 – Connecticut State Geospatial Council Meeting
Follow the link below for a map and directions to the event!
http://explorer.arcgis.com/?open=b4908f2573ab4e4ea5f188b7a25e8a8f 

Tweeting Around the World

A screenshot of languages used on Twitter in the Americas.

Since its inception, social media has spread rapidly. One of the most globalized products is Twitter, which allows users to send out short messages to followers. It is estimated that users send out approximately 200 million of these messages a day. Being such a globalized product, the languages spoken by users includes much more than just English, as you can see in the map screenshots below (the full map is available on Flickr).

A screenshot languages used on Twitter in Europe and Asia.
The Legend for the map.

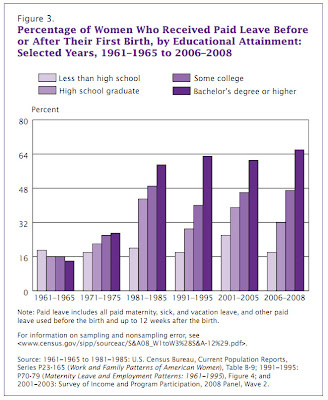
First Time Mothers: Maternity Leave & Employment Patterns

A pattern of the past few decades: women are more likely to work before and after the birth of their first child than they were in the past.
The U.S. Census Bureau’s recently published report regarding first time mothers and employment patterns indicates expectant mothers have changed their employment patterns dramatically in the past few decades. Women are now more likely to work while pregnant with, and after the birth of, their first child than they were in the 1960’s. This can, at least in part, be attributed to an increase in access to maternity leave. The likelihood of having access to paid leave varies with age, hours worked, and educational attainment. Read the full report for more.

A new U.S. Census Bureau report shows that women with higher educational attainment are more likely to work preceding the birth of their first child.

The U.S. Census Bureau’s report also indicates women with higher educational attainment are more likely to  receive paid leave before or after their first birth.

Connecticut GIS Day Schedule of Events – November 17, 2011

GIS Day for the State of Connecticut is fast approaching (November 17) and is being held at the State Legislative Office Building (300 Capitol Ave, Hartford, CT).
This year, the poster gallery includes 60 maps which are proudly displayed in the concourse of the State Legislative Office Building. Included below is the schedule of events for Connecticut’s GIS Day:

9:45 – Opening remarks and welcome

10:00 – ESRI – “Wizardry of the Flex Viewer in ArcGIS Server 10”

10:30 – Town of Milford – “Using a map when the lights go out – GIS and Storm Recovery”

11:00 – DEEP – “Highlighting GIS applications for Coastal and Environmental Management”

11:30 – USGS – “USGS Products for Large Scale Emergencies”

12:00 – LUNCH

1:00 – Connecticut State Data Center – “The numbers are in: 2010 Census for Connecticut”

1:30 – Connecticut Dept. of Agriculture – “Using GIS for shellfish resource management”

2:00 – HIFLD – “Hurricane Irene: Making sense of the remote sensing effort”

2:30 – Connecticut State Geospatial Council Meeting

Voting for the People’s Choice award for the map posters will take place all day! Winners will be announced in December with special prizes! Come out to take in the presentations, see the map gallery and the table displays, and network with your fellow GIS colleagues.

Census Bureau Webinar to Highlight Migration Data – November 15, 2011

What:
The U.S. Census Bureau will hold an audio news conference to release four migration-related data products. Statistics from the Current Population Survey and American Community Survey examine topics including the likelihood of people moving and how this rate has changed over time, the reasons people move, how common it is for people to live in their state of birth, and the most common sets of state-to-state moves.

The news conference will consist of a simultaneous audio conference and online presentation. Information on accessing the online presentation is provided below. Reporters will be able to ask questions once the presentation is complete. We suggest reporters log in and call in early.

 
When:
Tuesday, Nov. 15, 2011; 10 a.m. (EST)
 
Who:
Alison Fields, chief, Journey-to-Work & Migration Statistics Branch, U.S. Census Bureau
William H. Frey, senior fellow, Metropolitan Policy Program, Brookings Institution
 
Details:
Audio conference ― access information
Toll free number: 888-989-7686
Passcode: CENSUS
Note: Stay on the line until operator asks for the passcode. Do not key in passcode.

Online presentation ― access information
Please login early, as some setup is required.

URL: https://www.mymeetings.com/nc/join/
Conference/meeting number: PW8836688
Conference/meeting passcode: CENSUS
If closed captioning required: http://livewrite.nccsite.com/view/cb1115

Facts for Features – Veterans Day 2011: Nov. 11

Veterans Day 2011: Nov. 11

Veterans Day originated as “Armistice Day” on Nov. 11, 1919, the first anniversary of the end of World War I. Congress passed a resolution in 1926 for an annual observance, and Nov. 11 became a national holiday beginning in 1938. President Dwight D. Eisenhower signed legislation in 1954 to change the name to Veterans Day as a way to honor those who served in all American wars. The day honors military veterans with parades and speeches across the nation. A national ceremony takes place at the Tomb of the Unknowns at Arlington National Cemetery in Virginia.

Veterans

21.8 million

The number of military veterans in the United States in 2010.
Source: 2010 American Community Survey

1.6 million

The number of female veterans in 2010.
Source: 2010 American Community Survey

2.4 million

The number of black veterans in 2010. Additionally, 1.2 million veterans were Hispanic; 265,000 were Asian; 156,000 were American Indian or Alaska Native; 28,000 were Native Hawaiian or Other Pacific Islander; and 17.5 million were non-Hispanic white. (The numbers for blacks, Asians, American Indians and Alaska Natives, Native Hawaiians and Other Pacific Islanders, and non-Hispanic whites cover only those reporting a single race.)
Source: 2010 American Community Survey

9 million

The number of veterans 65 and older in 2010. At the other end of the age spectrum, 1.7 million were younger than 35.
Source: 2010 American Community Survey

When They Served

7.6 million

Number of Vietnam-era veterans in 2010. Thirty-five percent of all living veterans served during this time (1964-1975). In addition, 4.8 million served during the Gulf War (representing service from Aug. 2, 1990, to present); 2.1 million in World War II (1941-1945); 2.6 million in the Korean War (1950-1953); and 5.5 million in peacetime only.
Source: 2010 American Community Survey

49,500

Number of living veterans in 2010 who served during the Vietnam era and both Gulf War eras and no other period. Other living veterans in 2010 who served during three wars:
  • 54,000 served during World War II, the Korean War and the Vietnam era.

Living veterans in 2010 who served during two wars and no other period:

  • 837,000 served during both Gulf War eras.
  • 211,000 served during both the Korean War and the Vietnam era.
  • 147,000 served during both World War II and the Korean War.

Source: 2010 American Community Survey

Where They Live

3

Number of states with 1 million or more veterans in 2010. These states were California (2 million), Florida (1.6 million) and Texas (1.6 million).
Source: 2010 American Community Survey

14.1

Percent of people 18 and older in Alaska who were veterans in 2010. The percent of the 18 and older population who were veterans was 12 percent or more in Maine, Montana, Virginia and Wyoming.
Source: 2010 American Community Survey

Education

26%

Percent of veterans 25 and older with at least a bachelor’s degree in 2010. In comparison, 28 percent of the total population had a bachelor’s degree or higher.
Source: 2010 American Community Survey

92%

Percent of veterans 25 and older with a high school diploma or higher in 2010, compared with 86 percent of the population as a whole.
Source: 2010 American Community Survey

Income

$35,367

Annual median income of veterans, in 2010 inflation-adjusted dollars, compared with $25,605 for the population as a whole.
Source: 2010 American Community Survey

On the Job

9.6 million

Number of veterans 18 to 64 in the labor force in 2010.
Source: 2010 American Community Survey

Disabilities

26%

Percent of veterans for whom poverty status is determined with a disability in 2010.
Source: 2010 American Community Survey

3.4 million

Number of veterans with a service-connected disability rating. Of this number, 698,000 have a rating of 70 percent or higher. Severity of one’s disability is scaled from 0 to 100 percent and eligibility for compensation depends on one’s rating.
Source: 2010 American Community Survey

Voting

15.8 million

Number of veterans who voted in the 2008 presidential election. Seventy-one percent of veterans cast a ballot in the presidential election.
Source: Voting and Registration in the Election of November 2008
<http://www.census.gov/hhes/www/socdemo/voting/index.html>

12.4 million

Number of veterans who voted in the 2010 congressional election. Fifty-seven percent of veterans voted in the 2010 congressional election.
Source: Voting and Registration in the Election of November 2010
<http://www.census.gov/hhes/www/socdemo/voting/index.html>

Business Owners

9%

Percentage of all U.S. nonfarm firms that are majority owned by veterans. Veteran-owned firms comprised an estimated 2.4 million of the 27.1 million nonfarm businesses nationwide in 2007.
Source: Survey of Business Owners: 2007 <http://www.census.gov/econ/sbo>

75%

Percentage of veteran owners of respondent firms who were 55 or older in 2007. This compares with 37 percent of all owners of respondent firms. Similarly, in 2007, 56 percent of veteran-owned respondent firms with employees reported that their businesses were originally established before 1990. This compares with 39 percent of all employer respondent firms.
Source: Survey of Business Owners: 2007 <http://www.census.gov/econ/sbo>

8%

Percentage of veteran owners of respondent firms who were disabled as the result of injury incurred or aggravated during active military service.
Source: Survey of Business Owners: 2007 <http://www.census.gov/econ/sbo>

Editor’s note: The preceding data were collected from a variety of sources and may be subject to sampling variability and other sources of error. Facts for Features are customarily released about two months before an observance in order to accommodate magazine production timelines. Questions or comments should be directed to the Census Bureau’s Public Information Office: telephone: 301-763-3030; fax: 301-763-3762; or e-mail: <PIO@census.gov>.