NPR and the Center for Public Integrity Investigate Poisoned Places of the U.S.

The interactive map from Poisoned Places: Toxic Air, Neglected Communities displays Toxic Inventory Release Information.

NPR and the Center for Public Integrity have teamed up for a special investigation series entitled Poisoned Places: Toxic Air, Neglected Communities. This series takes a hard look at the environmental protection, or like there of, in American communities. The series’ website includes an interactive map (see screenshot above) that displays the distribution of polluters all over the country. The map displays Toxic Release Inventory information, like the EPA’s myRight-to-Know application, but is much more user friendly than the EPA product.

More on this NPR series:

Part 1: Secret ‘Watch List’ Reveals Failure to Curb Toxic Air

Part 2: Oklahoma Town Battles Powdery Carbon Pollution

The Changing Landscape Of Cape Cod

Scientists at the Woods Hole Research Center “combine analysis of satellite images of the Earth with field studies to measure, model, and map the Earth’s ecosystems, from thawing permafrost in the arctic to the expanding agriculture regions of the tropics.” The WHRC studies regions all over Earth, including their own backyard. The second half of the 20th century brought significant changes to the home of the WHRC, Cape Cod, including a doubling in the population. This increase in population has transformed land use patterns, and consequently the landscape, dramatically. The images below depict land use: dark green represents forests, yellow represents residential areas, red represents commercial and industrial areas, light brown represents salt marshes, pale brown represents sand, while orange represents agricultural areas:

1951

1985

2005

The WHRC has made a variety of resources available regarding the Cape, including time series photographs of Falmouth, maps of land cover change by town, a description of critical habitats, and an exploration of why some areas on the Cape should be a priority for local governments to acquire.

Join us for the Geography Awareness Week Kickoff Event – November 3, 2011 @ UConn

Are you interested in learning more about your local community through a geographic lens? Join us for today’s (November 3, 2011) event at the UConn Storrs Campus. Drop in registrations are welcome and UConn students are admitted for free! Details are included below.


Geography: The Adventures in Your Community
Thursday, November 3, 2011 4:45-8:00pm
Thomas J Dodd Research Center at UConn
Storrs, Connecticut
The heart of this year’s theme will revolve around a series of topics that encourage individuals or teams of students, families, or friends to explore their own communities through geographic eyes, and challenge them to look at things from a geographic perspective.
Program Agenda
4:00-4:30 Pre-conference tour of UConn Libraries – MAGIC
4:30-4:45 Registration – Thomas J. Dodd Research Center
4:45-5:00 Welcome – Bill DeGrazia & Tom Brodnitzki, CGA Co-Coordinators
5:00-6:00 Keynote Speaker – Arthur Bakis – U.S. Census Bureau Boston Regional Office
6:05-6:55 Buffet Dinner and Remarks
7:00-7:50 Breakout Sessions
I – Elementary Teachers – Allyson Lubs, Professional Development CGA
II – Middle & High School Teachers – Kristie Blanchard, NE Geography Teacher of the Year
III – Exploration of American Community Survey (ACS) –
Michael Howser, Connecticut State Data Center
7:50-8:00 CEU Records and Drawings

Participation Fee: $25 (add $10 if you would like to be awarded .3 CEUs upon completion of the program). The fee includes registration and a light dinner. Checks should be made payable to “Connecticut Geographic Alliance.
Pre-Service Teachers receive a reduced registration fee of $10 and currently enrolled UConn Students receive free admission.
This workshop is a collaboration of the Connecticut Geographic Alliance, University of Connecticut Department of Geography, University of Connecticut Libraries Map and Geographic Information Center (MAGIC), and the Connecticut State Data Center.
Participants can register at the door for this event.

Census Bureau Reports State and Local Governments Revenue (Nationally) Declines 22 Percent in 2009

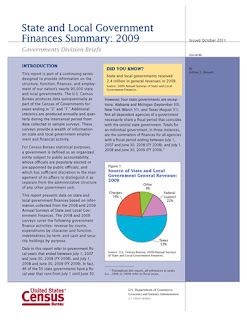
In 2009, state and local governments brought in nearly $2.1 trillion, a 22.1 percent ($587.5 billion) decrease from 2008, according to statistics from the U.S. Census Bureau. Most tax revenue categories saw declines except property tax, which saw a 3.7 percent increase to $424.0 billion.

These findings come from the 2009 Annual Surveys of State and Local Government Finances, which include statistics on revenues (including taxes), expenditures, debt and assets (cash and security holdings) for state and local governments.
Revenue from the federal government increased 12.3 percent from $478.0 billion to $536.8 billion between 2008 and 2009. (See Table 1 [Excel])
Spending increased 4.6 percent for state and local governments, totaling almost $3.0 trillion in 2009. Education continued to be the largest expense ($850.7 billion), followed by public welfare, which consisted of support of and assistance to needy people ($431.1 billion) and insurance trust ($275.5 billion). (See Table 1 [Excel])
Debt outstanding for state and local governments increased $131.1 billion (5.1 percent) to $2.7 trillion in 2009.
State and local spending on education comprised more than 33.0 percent of expenditures in nine states (Alabama, Arkansas, Georgia, Kansas, New Jersey, Texas, Vermont, Virginia and West Virginia). Elementary and secondary education totaled more than 24 percent of spending in New Jersey (25.8 percent) and Georgia (24.3 percent). Maine led the nation in state and local government spending on public welfare as a percentage of total spending (24.1 percent). (See Table 3 [Excel] and Table 4 [Excel])
For local governments, property tax revenue was up 3.7 percent to $411.0 billion. Public welfare spending increased 2.1 percent for local governments, led by vendor payments (payments to private vendors for medical care, hospital care, and other goods and services provided to needy people), which jumped 11.5 percent to $6.3 billion in 2009. Spending on utilities increased 6.4 percent, led by transit spending, which increased 13.8 percent. (See Table 2 [Excel])
Other highlights for state and local government finances:
  • Unemployment compensation saw an 86.0 percent increase from $35.6 billion in 2008 to $66.2 billion in 2009.
  • Insurance benefits and repayments increased 17.9 percent to $275.5 billion.
  • Spending on administering social insurance increased 12.6 percent from $4.1 billion in 2008 to $4.6 billion in 2009.
  • Revenue from individual income taxes decreased 11.3 percent from $304.9 billion to $270.5 billion.
  • Corporate income taxes revenue declined 19.2 percent to $46.0 billion.
  • Insurance trust revenue dropped 683.5 percent to $-498.0 billion, driven by employee retirement losses. Insurance trust revenue includes retirement and insurance contributions and earnings and losses on investment assets.
  • Cash and security holdings decreased 15.0 percent to $4.6 trillion because of a decrease in employee retirement assets, which declined 23.8 percent in 2009.
  • Spending on highways comprised more than 10.0 percent of expenditures in Alaska, North Dakota and South Dakota. (See Table 3 [Excel])
Data in this report are subject to sampling variability as well as nonsampling errors. Sources of nonsampling errors include errors of response, nonreporting and coverage. More details covering the design methodology are available online at <http://www2.census.gov/govs/estimate/2009_Local_Finance_Methodology.pdf>. All comparative statements in this report have undergone statistical testing, and unless otherwise noted, all comparisons are statistically significant at the 10 percent significance level.

Source: U.S. Census Bureau

Poverty Among Latino Children At An All-Time High

According to a Pew Hispanic Center report, poverty among children in the U.S. is now highest in the Latino population.

According to a recent report from the Pew Hispanic Center, poverty among Latino children is at an all time high and, for the first time, has displaced White children as the single largest group of children in poverty:


More Latino children are living in poverty—6.1 million in 2010—than children of any other racial or ethnic group. This marks the first time in U.S. history that the single largest group of poor children is not white. In 2010, 37.3% of poor children were Latino, 30.5% were white and 26.6% were black.”


Also according to the report, while about two-thirds of the children’s parents immigrated to the United States, an overwhelming majority (86%) of the children were born in America. It seems that this increase, both relative and absolute, is another impact of the Great Recession:


“Prior to the Great Recession, more white children lived in poverty than Hispanic children. However, since 2007, that pattern has reversed. Between 2007 and 2010, an additional 1.6 million Hispanic children lived in poverty, an increase of 36.3%. By contrast, even though the number of white and black children living in poverty also grew, their numbers grew more slowly—up 17.6% and 11.7% respectively.”


Cravify Maps Occupy Wall Street Tweets

Cravify features an interactive map of tweets related to the Occupy Wall Street demonstrations.

Cravify, a location based classified ads search engine, has developed a map of tweets related to the Occupy Wall Street movement. Similar to the map developed by ESRI, this map aggregates tweets related to the demonstrations and displays them over an easy to navigate basemap which, in the case Cravify, is Google Maps. Follow this link for more on Cravify or follow the developers on Twitter (@Trung_cravify and @humphrey_f).

Mapping Historical Photographs – Old S.F.

Old S.F. is an application which displays historical photographs in the San Francisco Bay area over a Google Maps basemap. The developers (who can be followed on Twitter: @danvdk and @ravejk) geocoded thousands of images based on the subject of respective photographs in addition to cross streets in the images. According to the site, the developers have geocoded 13,000 out of 20,000 photographs, found in the San Francsico Historical Photograph Collection, that have information regarding location. 


U.S. Census Economic Indicators Discussion on C-SPAN – October 21, 2011 at 9am

On Friday, Oct. 21, from 9:00 a.m. to 10:00 a.m., Bill Bostic, U.S. Census Associate Director for Economic Programs, will appear live on C-SPAN’s Washington Journal to discuss key economic indicators and how they measure our economy. His presentation will include a rich mix of statistical visualizations and discussion, including a public call-in segment.

You can view this event and watch the program either on C-SPAN  from 9-10am on Friday October 21 or live through the Internet at:
http://www.c-span.org/Series/Washington-Journal/ (Not viewable until tomorrow, October 21, 2011)

For more information and to view the presentation graphs, please visit the following link, which will be live Friday morning (Oct. 21): http://www.census.gov/newsroom/releases/archives/miscellaneous/econ_ind.html

A recording of the presentation will be available afterward from the Ethernet TV Media Library.

Be sure to follow the U.S. Census Bureau on Facebook and Twitter for an ongoing discussion of economic indicators and for other information from the Census Bureau.