US Census Bureau tools

Several new tools have been made available by the US Census Bureau to aid in performing research. The following have been released recently:

My Congressional District App

  • Allows users to find basic demographic and economic statistics for every snapcongressional district in the US. Uses latest annual statistics from the American Community Survey.
  • Users can sort through stats in 5 key categories. Summary level statistics cover education, finance, jobs and housing, as well as basic demographic info. Can be downloaded and shared with others.
  • A selected district can be embedded on a user’s own webpage.

Tool for Assessing Statistical Capacity (TASC)

  • Sponsored by the U.S. Agency for International Development (USAID).
  • Measures overall capacity of a country’s national statistical office to conduct population and housing censuses or surveys.
  • Tool aids them in identifying areas where improvement is needed and can help them justify the need for additional training or funding for hardware and software. It also provides an objective, quantitative assessment of areas of strength and improvement over time.
  • The TASC takes roughly four days to administer, with scores calculated from answers provided by the staff of these offices. Specific areas measured by the TASC include mapping, questionnaire content and testing, sampling, field operations, data processing, data analysis and evaluation, and data dissemination.
  • The Census Bureau’s International Programs Center for Technical Assistance is available to administer the TASC and provide technical support on a reimbursable basis that addresses the primary needs of the statistical office as identified by the scores. However, the TASC is available to any expert for assessing statistical capacity. The TASC toolkit can be downloaded online at

Census Bureau Interactive Language Map

  • The map pinpoints the wide array of languages spoken in homes across the nation, along with a detailed report on rates of English proficiency and the growing number of speakers of other languages.
  • The 2011 Language Mapper shows where people speaking specific languages other than English live, with dots representing how many people speak each of 15 different languages. For each language, the mapper shows the concentration of those who report that they speak English less than “very well,” a measure of English proficiency. The tool uses data collected through the American Community Survey from 2007 to 2011.
  • The languages available in the interactive map include Spanish, French, French Creole, Italian, Portuguese, German, Russian, Polish, Persian, Chinese, Japanese, Korean, Vietnamese, Tagalog and Arabic. After selecting one of these languages from the menu, users will see a national population density map, with each dot representing about 100 people who speak the language at home placed where these speakers are concentrated. The map also allows users to zoom in to a smaller geographic area, where each dot represents 10 people. The dots were placed in a random location within census tracts to protect the confidentiality of speakers.

Sequester to impact data distribution

Due to the federal sequester, the release of several datasets will be cancelled or altered.

BEAThis notice, from the Bureau of Economic Analysis (BEA) describes the impact that budget restrictions and sequestration will have on specific datasets. To summarize, the three datasets that will be most impacted are the Regional Input-Output Modeling System (RIMS) which was used to estimate economic impacts of Hurricane Katrina and the Deepwater Horizon event. The dataset (RIMS II) will be eliminated, and though orders will continue to be accepted and processed through the end of the fiscal year, the dataset will not be updated in future years. The Local Area Personal Income Statistics (LAPI) dataset will also not be published. According to the BEA, this dataset “constitutes the only source for county and metropolitan area personal income statistics and are the building blocks for other regional economic statistics.” The third affected dataset is Foreign Direct Investment Analytical Products. According to the notice that was released, “the BEA will eliminate analytical activities related to the DFI and the operations of multinational companies (MNCs), which will affect some annual publications as well as occasional topical papers.” Other types of statistics that will be affected in this dataset include information on offshoring, impact of MNCs on domestic economy, and the impact of global value chains for measuring economic activity.

In terms of Census data, CensusBureauthe Census Bureau has released a notice stating that the 2010 Census Public Use Microdata Sample (PUMS) files, which were originally scheduled for release from March through June 2013, have been delayed and will most likely be cancelled.

Similar information can be found by using the American Community Survey PUMS files which are very similar to the 2010 Census PUMS files.

The foreign born population in the US and Connecticut

According to the Census Bureau, America’s foreign born population has undergone dramatic changes in size, origins and geographic distribution within the past 50 years.  This infographic created by the Census Bureau depicts some of the major trends and statistics. As just one example: in 1960, 75% of foreign born individuals in the US were from Europe; but in 2010 only 12% were from Europe, while 53% were from Latin America and 28% were from Asia.

Here’s a snippet:

Foreignborn

So, who is emigrating from Asia to the United States? In 1960 only 0.5 million people immigrated to the US from Asia, but by 2000 it had risen to 8.2 million, and in 2011 that number had reached 11.6 million, according to the ACS report linked to above.

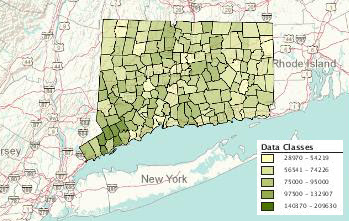
Here in Connecticut, the 2007-2011 ACS data from American FactFinder shows that the total population was 3,558,172 with foreign-born individuals (both citizens and non-citizens) numbering 474,139 (+/- 5,979); thus comprising between 13.2% and 13.5% of the total population. By comparison, in 1960 the US Census reported that the total population of Connecticut was 2,535,234 and that 38.7% of that total (982,143) was foreign born with a majority (237,146) of individuals from Italy. The following visualization shows countries where foreign-born individuals emigrated from in 1960 that had numbers of emigrants higher than 20,000 individuals. Click the visualization to interact more with the data.

The other countries or areas that the Census recorded individuals emigrating from include: Norway, Denmark, Netherlands, Switzerland, France, Finland, Yugoslavia, Romania, Greece, Portugal, Asia and Mexico. There were also categories for Other and Unknown. Both Asia and Mexico now comprise higher emigration rates; but in 1960, only 645 people from Mexico came to Connecticut, and 11,786 came from Asia. The ACS 2007-2011 estimates for foreign born place of birth show that by 2011 there were 105,365 emigrants from Asia and 25,743 from Mexico. The emigration pattern has certainly changed in Connecticut since the 1960s, see below visualization for the countries in 2011 from which more than 20,000 people emigrated (including those with a MOE that causes the estimate to exceed 20,000); and unlike the 1960s, there are very few countries from which 20,000 or more people emigrated.The one country with the single highest number of foreign-born individuals in CT was Jamaica, with 34,742 individuals. In terms of regions broken down by continent, the highest number of individuals collectively came from Latin America which includes the Caribbean, Central and South America (197,224).
2011_fbp


Geography of the Foreign-Born Population, 1960-2010: Census Bureau Report

The foreign-born population of the United States has shifted since 1960 from a largely European composition of nation of origin settled in Northeastern and Midwestern states to, present-day, people of Asian and Latin American origin living more in the west and south of the country. This is the central finding of a new working paper from the U.S. Census Bureau’s Population Division, The Size, Place of Birth, and Geographic Distribution of the Foreign-Born Population in the United States: 1960 to 2010, released earlier this month.

In 1960, the top five countries of origin for immigrants to the United States – Italy, Germany, Canada, United Kingdom, Poland – comprised 49.1 percent of the country’s total foreign-born population. In 2010, however, the five largest nationalities represented in the immigrant population of the country were Mexico, China, India, Philippines, and Vietnam. These five comprised 46.7 percent of the total foreign-born population, with people from Mexico making up nearly 30 percent of that composition. This significant difference in the nations of origin, as the composition shifts from immigrants of European countries to Latin American and Asian nations, is highlighted in the report.

Also discussed in this report is the demographic shift in age to a younger population, from a median age of 57.3 in 1960 to 41.4 in 2010. These start and end data hide the fact that, for the years 1980, 1990, and 2000, the median age dropped below 40, reaching a nadir of 37.2 in 1990. The authors of the report understand this trend to be a result of the decline of the older European population through mortality, in combination with the influx of a younger Asian and Latin American immigrant population.

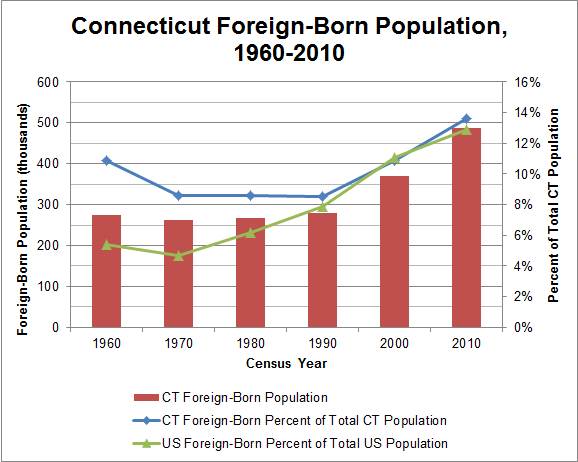
In the state of Connecticut, the report presents data showing a U-shaped transition in the state’s foreign-born population during the study period of 1960 to 2010. First, during the period of 1960 to 1990, the number of foreign-born people varied within 20,000 between any two Census years. This stagnancy in total numbers explains the decline in the foreign-born population as a proportion of the total Connecticut population, increasing during the entire study period. The population of foreign-born residents dropped from 10.9 percent of the total population in 1960 to 8.5 percent in 1990.

More recently, however, the Census data shows a significant growth in Connecticut’s foreign-born population, nearly doubling from approximately 279,000 in 1990 to just over 487,000 in 2010. As a percentage of the total state population, the foreign-born cohort also increased to 13.6 percent in 2010. In the chart above, this latter, increasing trend in the state’s foreign-born population matches relatively closely to the change in the population composition percentages for the entire United States, which has been steadily increasing since 1970.

View the entire report here: The Size, Place of Birth, and Geographic Distribution of the Foreign-Born Population in the United States: 1960 to 2010.

2011 American Community Survey Release Schedule

The U.S. Census Bureau schedule for the release of the American Community Survey data for 2011 starting in September of 2012 is now available. Included below are details on each release so be sure to make your calendars as this data will be available via the American FactFinder website once the data is released.

2011 American Community Survey — The Census Bureau plans to release one-year estimates from the 2011 ACS on Thursday, Sept. 20, 2012. The ACS produces estimates for numerous social, economic and housing characteristics including language, education, the commute to work, employment, mortgage status and rent, as well as income, poverty and health insurance. Embargo subscribers will have access on an embargoed basis to the estimates beginning Tuesday, Sept. 18. Estimates will be available for the nation, all 50 states, the District of Columbia, Puerto Rico, every congressional district, every metropolitan area, and all counties and places with populations of 65,000 or more. In June 2011, the ACS annual sample size was increased from 2.9 million to 3.54 million addresses, which should result in an improvement in the reliability of the estimates.

On Sept. 20, the Census Bureau will also release the first in a series of short briefs that analyze a wide range of topics. Additional briefs will follow. Each year, the Census Bureau varies the topics of these short briefs.

2009-2011 American Community Survey — The Census Bureau plans to release the three-year estimates from the 2009-2011 ACS on Oct. 25, 2012. Embargo subscribers will have access to the estimates up to 48 hours in advance of the public release. The estimates will cover all geographic areas with populations of 20,000 or more. They will include the first set of three-year estimates for field of degree of bachelor’s degree holders.

2007-2011 American Community Survey — The Census Bureau plans to release the five-year ACS estimates covering 2007-2011 on Dec. 6, 2012. Embargo subscribers will have access to the estimates on Dec. 4. These estimates are available for all areas regardless of population size, down to the block group.
The ACS Public Use Microdata Sample (PUMS) files for each of the three sets of statistics will be released one to two months after each public release.

Overviews provided by U.S. Census Bureau

“Free and clear” mortgage status data from the American Community Survey and 2010 Census

 Despite the expansion of mortgage debt in the last decade, according to the latest American Community Survey data one third of owner-occupied households (i.e. those owning – not renting or leasing – their house, condo, apartment, etc.) own their homes “free and clear” of any mortgage or home equity loan. In gathering this data, the Census Bureau’s American Community Survey questionnaire asks whether owner-occupied properties have a “mortgage, deed of trust, or similar debt,” and in the absence of any primary mortgage, whether there is a second mortgage or home equity loan (questions 19 and 20). Nationally, more than 24 million homes – 32.8% of owner-occupied housing units – have no primary or secondary mortgages. The prevalence of free and clear mortgage status for owner-occupied housing units varies regionally from 23.5% in Maryland, to 50.3% in West Virginia:

<a href=”undefined”><img alt=”Dashboard 1 ” src=”http://public.tableausoftware.com/static/images/Mo/MortgageStatusAgeandIncome/Dashboard1/1_rss.png” style=”border: none” /></a>

 Connecticut lags slightly behind the national average in the percentage of owner-occupied housing units owned free and clear in the state; according to American Community Survey 2010 data, 28.5% of owner-occupied homes in Connecticut have no mortgage debt. Of these households, trends in the age of the householders, and median household income, were consistent with national trends. About 60% of the householders (the individual completing the ACS questionnaire) in mortgage-free households were 65 or older; 39% were aged 35-64, and only 1.4% were under 35. In Connecticut, as in all states, median household income in owner-occupied homes is significantly less than in households where the home is mortgaged. Median household income in Connecticut among households carrying a mortgage was $94,298, while median income in mortgage-free households was $52,435.

 Homeownership and mortgage status data were also gathered by the 2010 Census. Question 3 of the 2010 Census questionnaire asked if the housing unit was either “owned by you or someone in this household with a mortgage or loan? Include home equity loans”, or “owned by you or someone in this household free and clear (without a mortgage or loan)”. For mortgage status information at the town level, the Census 2010 data provides more current data than the ACS 5-year Estimates. According to 2010 Census figures, 26.4% of owner-occupied homes in Connecticut were owned free and clear (slightly less than the figures published for the 2010 ACS 2010 1-year estimate). Free and clear status among owner-occupied homes among Connecticut towns ranged from 16.2% in Sterling, to 41.2% in Cornwall.

<a href=”undefined”><img alt=”Dashboard 1 ” src=”http://public.tableausoftware.com/static/images/of/ofCThomesownedfreeandclear/Dashboard1/1_rss.png” style=”border: none” /></a>

For detailed data from the American Community Survey in American FactFinder, see:

For additional data on mortgage status from the 2010 Census in American FactFinder, see:

A Future Without Key Social and Economic Statistics for the Country?

This past week, the U.S. House of Representatives passed a bill that contains the Census Bureau’s budget. This bill includes several cuts which would impact several datasets including the Economic Census and the American Community Survey (ACS), datasets which provides key economic, population, and housing data critical for planning, analysis and decision making by state and federal agencies, non-profit organizations, private industry, businesses, and researchers.

With the 2010 Census not including a long form, the American Community Survey is THE source for detailed income, poverty, and population data. If the American Community Survey is no longer available, critical datasets for planning, analysis and decision making will no longer available, leaving a great void in data needed for informed decision making in the private and public sectors.

Please take a few moments to review the following link includes a blog post from Dr. Robert Groves, U.S. Census Director, to learn more about how this bill could drastically alter data collection in this country. http://directorsblog.blogs.census.gov/2012/05/11/a-future-without-key-social-and-economic-statistics-for-the-country/

Included below is a brief video from Dr. Robert Groves about the impact this bill could have on data collected by the U.S. Census Bureau.

Census Bureau Releases First Information Since 2000 Census on Moves Between Counties

Census Bureau Releases First Information Since 2000 Census on Moves Between Counties

Maricopa, Ariz., Receives Movers From and Sends Them to Largest Collection of Counties

The U.S. Census Bureau released estimates from the American Community Survey showing how many people migrated from one specific county to another during the course of a year ─ the first such numbers published since these data were collected as part of the 2000 Census.

The American Community Survey compiles data over a five-year period and asks people where they lived one year prior to being surveyed. The first five-year estimates released covers the years from 2005 to 2009.

The 2005-2009 American Community Survey County-to-County Migration Files provide tables for each county in the nation, showing both “inflows” and “outflows.” Inflows are the number of people living in a given county who lived in another specific county one year earlier; outflows represent the number of people who lived in a particular county one year earlier who subsequently moved to another specific county.

Of the 48.1 million people who lived in a different residence in the United States one year earlier, 17.7 million lived in a different county.

Maricopa, Ariz., had the largest number of inflows of people for any single county in the nation. People moved there from 993 different counties. Similarly, Maricopa led the nation with the largest number of counties in which it sent outflows of people ─ a total of 1,156 counties. This means that individuals leaving Maricopa were more dispersed throughout the country than individuals leaving any other county. Pinal, Ariz. (13,452 residents); Los Angeles (12,403); Pima, Ariz. (7,349); San Diego (6,693); and Coconino, Ariz. (3,994) were among the counties with the highest number of people moving into Maricopa.

Pinal (21,974), Pima (8,464), San Diego (4,156), Los Angeles (3,813) and Coconino (3,188) were among the counties with the highest number of moves out of Maricopa.

All in all, the most common county-to-county moves nationally were from Los Angeles to San Bernardino, Calif. (48,456 people) and Los Angeles to Orange, Calif. (41,612). Los Angeles to Riverside, Calif. (29,710); Orange, Calif., to Los Angeles (29,345); and Miami-Dade to Broward, Fla. (27,010) were among the next most common county-to-county moves.

Additionally, Los Angeles had both the highest number of people entering from another county as well as the highest number leaving for another county. On balance, however, it lost a net of about 160,000 people in this exchange.

Prior to this product, the only migration flow tables available from the American Community Survey covered state-to-state flows; the latest such release, from the 2010 one-year estimates, was published in November 2011. Later this year, the U.S. Census Bureau plans to release a file from the 2006-2010 American Community Survey five-year estimates showing county-to-county flows by demographic characteristics, such as age, sex, and race and Hispanic origin.

2006-2010 American Community Survey (ACS) 5 Year Data now available

The United States Census Bureau has released the 2006-2010 American Community Survey (ACS) 5 year estimates! This dataset includes updated socio-economic statistics covering every community in the nation, including all 169 towns in Connecticut. Included below are some examples of the data variables available from the 2006-2010 American Community Survey (ACS) 5 year estimates for Connecticut:

Median Household Income (2006-2010) by Town in Connecticut:

Click the map above to view interactive map

View Median Income Data by Town in Connecticut

Ratio of Income to Poverty Level for Families (under .5) (2006-2010) by Town in Connecticut:

Click the map above to view interactive map


View Ratio of Income to Poverty Level for Families Data by Town in Connecticut
 

How can I access the 2006-2010 ACS 5 year estimates data?
The American FactFinder provides access to the 2006-2010 ACS 5 year estimates data for Connecticut as well as the entire nation. From the American FactFinder users can search datasets, download datasets, and create interactive maps based on variables from the ACS.

At what geographic levels is the data available?
The ACS 5 year data is available at the national, state, congressional district, county, county subdivision (town), tract, and block group level. For those users interested in examining block group level data the margin of error values could be significant at the block group level so be sure to review the margin of error values closely as tract level data may provide less error.

Comparing ACS data to 2010 Census
For additional details on the American Community Survey and when/if comparisons of the data can be made to the 2010 census visit: http://www.census.gov/acs/www/guidance_for_data_users/comparing_data/

What if I have questions about using the ACS? 
Contact the Connecticut State Data Center at ctsdc@uconn.edu  and we will be happy to assist.

Census Bureau Webinar to Highlight Migration Data – November 15, 2011

What:
The U.S. Census Bureau will hold an audio news conference to release four migration-related data products. Statistics from the Current Population Survey and American Community Survey examine topics including the likelihood of people moving and how this rate has changed over time, the reasons people move, how common it is for people to live in their state of birth, and the most common sets of state-to-state moves.

The news conference will consist of a simultaneous audio conference and online presentation. Information on accessing the online presentation is provided below. Reporters will be able to ask questions once the presentation is complete. We suggest reporters log in and call in early.

 
When:
Tuesday, Nov. 15, 2011; 10 a.m. (EST)
 
Who:
Alison Fields, chief, Journey-to-Work & Migration Statistics Branch, U.S. Census Bureau
William H. Frey, senior fellow, Metropolitan Policy Program, Brookings Institution
 
Details:
Audio conference ― access information
Toll free number: 888-989-7686
Passcode: CENSUS
Note: Stay on the line until operator asks for the passcode. Do not key in passcode.

Online presentation ― access information
Please login early, as some setup is required.

URL: https://www.mymeetings.com/nc/join/
Conference/meeting number: PW8836688
Conference/meeting passcode: CENSUS
If closed captioning required: http://livewrite.nccsite.com/view/cb1115