Connecticut Census Tract Data Browser for American Community Survey Data

Census Tracts, statistical areas of roughly three to seven thousand individuals, are the smallest practical geography for analysis using American Community Survey estimate data. In Connecticut many smaller towns have a single Census Tract, while larger cities can have more than a dozen.The Census Bureau’s American FactFinder data tool provides more than 3,500 different tables of data from the American Community Survey for Census Tracts on a wide range of topics. While the organization, documentation, downloading capabilities of American FactFinder are extremely sophisticated, it can be difficult to identify and select particular Census Tract for analysis – say, those in the northern portion of Hartford – without already being familiar with the boundaries of the tracts. (While this can be done using the Reference Map interface in American FactFinder, it is a fairly cumbersome process).

The shaded map of Census Tracts below allows the user to select single or multiple tracts for analysis, and takes advantage of the deep linking capabilities of American FactFinder.  By holding down the Control key, multiple tracts can be selected with the mouse. The links to demographic, economic, and other data which then appear in the mouseover ‘Tooltip’ menu can be a starting point for exploring additional data for the selected tracts, because the geographies chosen remain selected in the resulting American FactFinder session. Upon following the link in the Tooltip to a table in American FactFinder, click the Advanced Search tab above the table to return to the American FactFinder search screen, to browse among the thousands of tables of data for the tract(s), using a keyword search or the Topics menu.

[xyz-ihs snippet=”Census-Tract-Data-Browser”]

Gini Index of Income Inequality for U.S. Counties

This visualization displays U.S. Census Bureau American Community Survey Gini index estimates for U.S. counties.  The Census Bureau defines the Gini index as “a statistical measure of income inequality ranging from 0 to 1. A measure of 1 indicates perfect inequality, i.e., one household having all the income and rest having none. A measure of 0 indicates perfect equality, i.e., all households having an equal share of income.” For an analysis of the ACS Gini index data, see the Census Brief: Houshold Income Inequality Within U.S. Counties.

The visualization allows the viewer to filter the counties displayed on the map by Gini index. Links into American FactFinder from the mouseover Tooltip for each county on the map provide further economic data including median household income, poverty, and insurance coverage data for the county.


“Lost” New England landscape found using LiDAR

magic_all

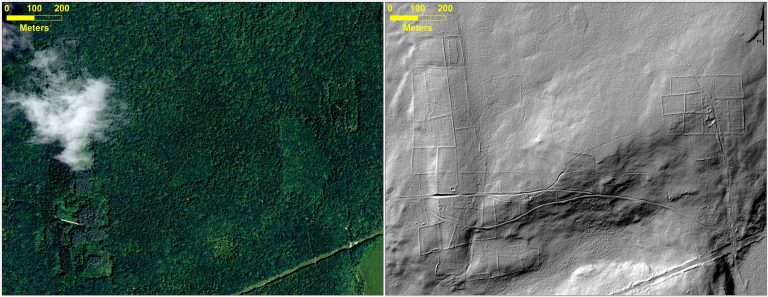
At top left, leaf-on 2012 aerial imagery from Connecticut (CTECO); top right is 2010 hillshaded DEM derived from LiDAR data showing stone walls, old road and building foundation; bottom is 1934 aerial photography (available from MAGIC and CT State Library)


New research by Geography graduate student Katharine Johnson and faculty William Ouimet was covered yesterday by National Geographic in their article “Lost” New England Revealed by High-Tech Archaeology. The article features a Q & A with Katharine Johnson, a PhD student in Geography and employee here at MAGIC and the Connecticut State Data Center.

You can read it (and see some cool graphics) here: http://news.nationalgeographic.com/news/2014/01/140103-new-england-archaeology-lidar-science

The article references a paper by Johnson and Ouimet that was recently accepted and published by the Journal of Archaeological Science about using Light Detection and Ranging (LiDAR) to identify and analyze the historic agricultural landscape of New England that is now hidden by the forest canopy in aerial photography but is visible using LiDAR. Check it out, here:  http://www.sciencedirect.com/science/article/pii/S0305440313004342

Sources of home heating used by Connecticut households

As Connecticut braces for arctic-like weather in the coming days, various energy sources will be used to heat our homes. The American Community Survey data collects on what home heating fuel sources are used in the state – fuel oil, grid-connected natural gas, electricity, wood, etc. Among Connecticut households, the majority (about 644,000) use fuel oil of some type, followed by households using utility gas (i.e. connected to street lines) – about 432,000 households – and electricity in 206,000 households. Wood is used by about 26,000 households in Connecticut, and its use is especially prevalent in the northeast corner of the state.

Use the Heating Source filter to display the use of that energy source across Census tracts in the state.