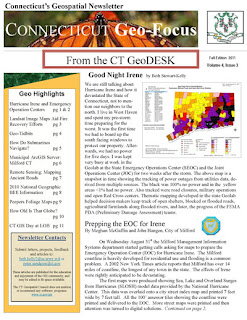
The latest issue of the Connecticut GeoFocus newsletter is now available and includes the following topics:
Category Archives: Connecticut
Tracking Migration Patterns in the U.S.
 |
| Migration patterns of Tolland County, CT from this Forbes interactive map. |
Are you interested in migration patterns in the U.S.? If so, check out this interactive map from Forbes, which is based on IRS data. The map details in and out migration by county. As an example, see the screenshot above of Tolland County, CT. It shows that between 2005-2009, 7,400 people migrated to Tolland County while 3,700 migrated away from Tolland County. The map also allows you to track where the in-migrants are coming from and where the out-migrants are going.
Join us at Connecticut GIS Day – November 17 @ 9:45am

There’s still time to join us at Connecticut’s GIS Day events being held today (November 17, 2011) at the Legislative Office Building in Hartford (300 Capitol Ave, Hartford, CT). Included below are details on this free event.
Connecticut GIS Day Schedule of Events – November 17, 2011
http://explorer.arcgis.com/?open=b4908f2573ab4e4ea5f188b7a25e8a8f
Link to the program flyer: http://www.ct.gov/gis/lib/gis/GIS_Day_Flyer_LOB_2011.jpg
Connecticut GIS Day Schedule of Events – November 17, 2011
Connecticut Power Outages
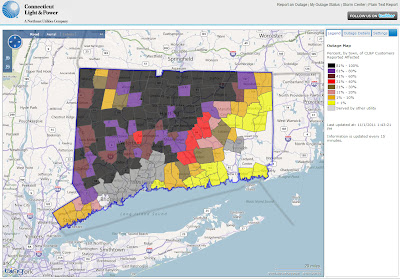
If, like me, you are still without power in Connecticut, you may find these following resources from Connecticut Light and Power useful:
Map of Affected Customers by Town – This map displays the percentage of CL&P customers affected by outages.
 |
| A screenshot of the CL&P outage map as of Tuesday, 2 PM. |
List of Estimated Restoration Projects by Town – This list displays the estimated time that restoration projects will be completed. Some estimates indicate that electricity will not be restored until this weekend, while other towns are shown at all.
 |
| A screenshot of restoration estimates as of Tuesday, 2 PM. |
Are Toxic Chemicals Being Released Near You?
 |
| Screenshots from the EPA myRight-to-Know app that show facilities registered with the Toxic Release Inventory: the left image shows the Storrs-Willimantic, CT area while the image on the right displays the Hartford, CT area. |
The Uninsured Population of Connecticut
 |
| Percentage of state populations that are uninsured from the 2010 American Community Survey 1 Year Estimate |
Connecticut GIS Day – Moved to November 17

Connecticut GeoFocus Fall Edition Now Available


