6/18/2011 – High Tech Treasure Hunting: Fun with GPS and Geocaching

The Connecticut State Museum of Natural History part of CLAS at UConn present:

High Tech Treasure Hunting: Fun with GPS and Geocaching

Cary Chadwick, Center for Land Use Education and Research (CLEAR)
College of Agriculture and Natural Resources, UConn

When: Saturday, June 18, 10 am to 12 noon

Where: Haddam, Connecticut

Registration: Advance registration required: $20 ($15 for Museum members) Adults and children ages 8 and above. Children must be accompanied by an adult.

Originally, the Global Positioning System (GPS) was for military use as a navigational aid. Today, the general public has access to this satellite-based technology, and using hand-held GPS devices they can participate in geocaching, a high-tech treasure hunt. The idea behind geocaching is to locate outdoor hidden containers called geocaches by using GPS coordinates listed on the Geocaching website, and then share your experiences with others online. Currently, there are 1,310,416 active geocaches and over 5 million participants worldwide! Cary Chadwick will teach you to use a hand held GPS unit. Then, everyone will go outdoors and hunt for practice caches using the coordinates given to you. One of these will be an officially registered geocache that you can list online.

Part of the Museum’s Natural History of Play series – Exploring how physical and biological processes have shaped play behavior in animals and what human expressions of play reveal about our changing relationship to the environment.

For registration information please visit
www.cac.uconn.edu/mnhcurrentcalendar or call (860) 486-4460.

2010 U.S. Census Connecticut Demographic Profiles Shapefiles Now Available

The 2010 U.S. Census Connecticut Demographic Profiles data and shapefiles that include this data are now available for Download from the Connecticut State Data Center website! Included below are the details on this dataset:

2010 U.S. Census Demographic Profiles Data for Connecticut
• Geographies available: State, 111th Congressional Districts, County, Connecticut House District, Connecticut Senate District, and Town
• Downloadable data available in .csv format for each geography and includes a data codebook to describe each column of data
• 2010 U.S. Census shapefiles which include the demographic profile data for each geography are provided in WGS 1984 and Connecticut State Plane NAD 83 projections and include FGDC metadata

2010 Census Shows Nation’s Population is Aging

Seven States Have Median Age Over 40

The U.S. Census Bureau released on May 26, 2011 a 2010 Census brief on our nation’s changing age and sex composition that shows the nation grew older while the male population grew faster than the female population over the last decade.

According to Age and Sex Composition: 2010 [PDF], the median age of Americans is now 37.2, with seven states recording a median age of 40 or older. The brief also shows the male population grew 9.9 percent between 2000 and 2010, while the female population grew 9.5 percent. Of the total 2010 Census population, 157.0 million people were female (50.8 percent) and 151.8 million were male (49.2 percent).

In the 2010 Census, seven states had a median age of 40 or older: Maine (42.7), Vermont (41.5), West Virginia (41.3), New Hampshire (41.1), Florida (40.7), Pennsylvania (40.1) and Connecticut (40.0). In both 1990 and 2000, West Virginia and Florida had the highest median age of all states. Maine overtook West Virginia and Florida as the state with the highest median age in 2010, while Utah remained the state with the lowest median age.

For more details visit: http://2010.census.gov/news/releases/operations/cb11-cn147.html

June 10, 2011 – CT GIS User to User Network Meeting on the 2010 U.S. Census

The Connecticut GIS User to User Network will hold its quarterly meeting on June 10, 2011 at the University of Connecticut’s Greater Hartford Campus from 9am – 12 pm. This meeting will focus on topics related to GIS and the 2010 U.S. Census and will feature presenters from the U.S. Census Boston Regional Office. This meeting will be held in the Information Technology Building Room 104 at the University of Connecticut Greater Hartford Campus. Included below is a tentative outline:

Tentative Outline

9:00-9:15am – Introductions

9:15 – 9:45am – Locating 2010 Census Data using the New American FactFinder

9:45 – 10:00am – Tips and Tricks

10:00 – 10:15am – Networking

10:15 – 10:45am – Using 2010 Shapefiles and joining data from the 2010 Census

10:45 – 11:00am – Break

11:00 – 11:45am – American Community Survey and comparing ACS with 2010 Census data

11:45am – 12:00pm – Question and Answer Session

Parking and Navigating Campus

Parking is available for free in the visitor lot at the corner of Ayslum Ave and Trout Brook Drive in West Hartford, CT. Once on campus, the Information Technology Center is a short walk from the Parking Lot. The following link includes a campus map that includes details on each building: http://hartford.uconn.edu/map/campus.html

For Driving directions to the University of Connecticut Greater Hartford Campus, visit the following website: http://hartford.uconn.edu/map/

Can’t Make it? Attend this meeting Virtually!

For those that are unable to attend this meeting in person, a live web stream from this meeting will be offered. If you are interested in attending this meeting virtually via a live web stream, please complete the following form so we can be sure to provide you a link to attend the meeting virtually: http://bit.ly/lHuOM9

GIS Tips and Tricks

CT GIS User to User Network would also like to encourage participants to bring a GIS related tip to share with meeting participants. These tips could include a favorite extension, script, and time saving resource that would be useful to other meeting participants. Feel free to bring your tip on a sheet of paper to share with other meeting participants.

We look forward to seeing you physically or virtually for this meeting on the June 10, 2011!

Get MicroData from the DataFerret!

DataFerret is a tool that mines and extracts data from 4 main types of data:

  • MicroData
  • Aggreagate or Summarized Data
  • Longitudinal Datasets
  • Time Series Datasets

This tool is very easy to use and may be helpful to user of PUMS data.  The program has the ability to export custom tables in a number of different formats and has the ability to create maps.

Check out the following links to get some more background information on the DataFerret and how to make use of this tool:

Here is a sample map of Average Income by PUMA’s in Connecticut, no GIS needed.

ACS 2005-2009 PUMS Data for Average Income

Connecticut Geo-Focus Newsletter – Spring 2011

The latest issue of the Connecticut Geo-Focus newsletter is now available. In this issue you will find articles and updates on the following topics:

  • Huge GIS Savings
  • The Tourism Map
  • CT Libraries and Job Centers Are Mapped
  • Newtown GIS
  • Geo-Tidbits
  • CT Trust for Historic Barns Survey
  • Vernon Saves Money Using GIS this Winter
  • Cost Sharing Partnership in 2011 Orthoimagery Project
  • CT 2010 NAIP 4Band Ortho-photography
  • Happy Birthday U2U
  • ESRI Technical Certification
  • ArcGIS Online Community Basemap Program
  • and more!

2010 Connecticut Census Data – Quick Facts

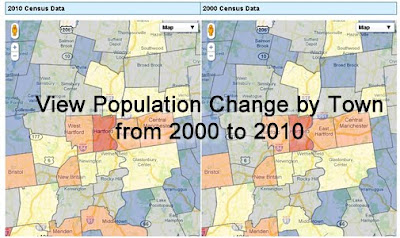
On Wednesday March 9, 2011 at 2:00pm the U.S. Census Bureau released the Connecticut redistricting data. This dataset includes total population, race, ethnicity, voting age (18+), and housing occupancy data for multiple geographies in Connecticut. To allow for quick comparisons between 2000 and 2010, the Connecticut State Data Center has created a dual map viewer which enables users to search for a town, click on the town, and view data from 2000 and 2010 side by side. Check out this Connecticut census data viewer!
Included below is a summary of quick facts from this 2010 Census data release for towns in Connecticut based on population increases and decreases from 2000 to 2010:

Connecticut Towns with Largest Increases in Population from 2000 to 2010

Town 2010 Population
1 New Haven, CT 6,153
2 Danbury, CT 6,045
3 Mansfield, CT 5,823
4 Stamford, CT 5,560
5 Bridgeport, CT 4,700
6 Middletown, CT 4,481
7 Norwich, CT 4,376
8 Hamden, CT 4,047
9 Manchester, CT 3,501
10 Southington, CT 3,341


Connecticut Towns with Population Decreases from 2000 to 2010

Town 2010 Population
1 Branford, CT 28,026 (-657)
2 Enfield, CT 44,654 (-558)
3 East Hampton, CT 12,959 (-393)
4 West Hartford, CT 63,268 (-321)
5 Sherman, CT 3,581 (-246)
6 Salisbury, CT 3,741 (-236)
7 Sharon, CT 2,782 (-186)
8 Old Saybrook, CT 10,242 (-125)
9 Bridgewater, CT 1,727 (-97)
10 New Fairfield, CT 13,881 (-72)

More details will be made available soon! Be sure to check out the newly redesigned Connecticut State Data Center website for 2010 Census data and shapefiles.

Connecticut Town Population 2010 & 2000 Interactive Map Now Available

The Connecticut State Data Center has just released an interactive map to allow users to view 2000 and 2010 Census data for Connecticut towns. This map viewer allows users to search for a Connecticut Town, click on the town to view population, race/ethnicity, voting age, and housing data for 2010 on the map on the left and the user can view 2000 Census data for the town in the map on the right.

The 2010 data was released on 3/9/2011 at 2:00pm and we are still enhancing this mapping interface and we welcome your feedback! Check out this interactive map by visiting the Connecticut State Data Center’s website and click on the Maps link or click the image below
Users can also download this data in spreadsheet (Microsoft Excel format) and in shapefile formats directly from the Connecticut State Data Center’s data page.

Census Bureau to Release Local 2010 Census Data for Connecticut

Next week (March 7-11, 2011), the U.S. Census Bureau anticipates releasing local-level 2010 Census population counts for Connecticut. This data released by the Census Bureau will provide summaries of:
  • Population totals
  • Race
  • Hispanic origin
  • Voting age

This data will be released for multiple geographies within the state, such as census blocks, tracts, voting districts, cities, counties and school districts.

According to Public Law 94-171, the Census Bureau must provide redistricting data to the 50 states no later than April 1 of the year following the census. As a result, the Census Bureau is delivering the data state-by-state on a flow basis in February and March. All states will receive their data by April 1, 2011.
When will this data be released?
Each state’s geographic products and redistricting data are first delivered to the state’s leadership, such as the governor and majority and minority leaders in the state legislative body. Upon confirmation of delivery to the state leadership, the US Census Bureau will release a news release with five custom tables of data. Within 24 hours, the full set of five detailed tables will be available to the public online via the American FactFinder.
For more information on the Census Bureau’s Redistricting Data Program, visit http://www.census.gov/rdo/.