Washington, D.C.: Then and Now

For a look into the past of Washington, D.C., check out the The Ruined Capitol Blog:

A photo depository and discussion dedicated to the comparison of buildings, culture, and society in Washington, D.C. that have been destroyed, replaced or miraculously preserved during the great architectural purge of the Federal City from 1930 to the 1980s.


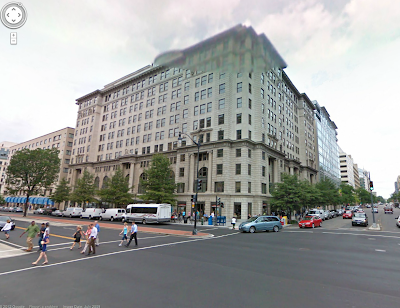
This blog features historical photos from locations in the nation’s capitol that show the evolution of its urban geography. It’s amazing to see some of these older photographs compared to their contemporary counterparts for a variety of reasons, but one is the difference in scale. An example of this can be seen in the two photographs below, at the intersection of K and 15th St NW (dated ca. 1922; Present). With wider roads and taller buildings, as the author notes, the urban design and architecture have given this location a tremendously different scale and sense of place.


The location of the intersection- courtesy of Google Earth:


For more of these before and after shots of D.C., visit The Ruined Capitol.


Mapping a Year in the Life of Boston

At the end of December, The Boston Globe ran this geographic narrative that mapped 17 events of 2011 in the city of Boston. Here are a few of my favorites:

  • 8. The puck stopped here – In June, the Bruins won their first Stanley Cup since 1972. Their victory sparked riots in Vancouver, home of their opponents. At home, the win was celebrated with a victory parade through downtown Boston.
  • 11. Whitey’s back – After 16 years on the lam, infamous South Boston gangster Whitey Bulger was captured in Santa Monica, Calif., and arraigned at Boston’s federal courthouse.
  • 12. Occupied! – The encampment in Dewey Square was one of the longest-lasting of the Occupy protests in major US cities. Protesters began the demonstration on Sept. 30; on Dec. 10, the camp was cleared by police, resulting in dozens of arrests.

Revisiting the Occupy Movement: Geographies of Protest

As the Occupy Movement spread across the United States this fall, we here at Outside the Neatline documented some of the geospatially-related web content that was created in response to the protests. Recently, I came across an excellent geographic examination of the protests in a two part post on the Regional Geogblog entitled Geographies of Protest and Occupation: From Manama, Bahrain to Richmond, Virginia. The blog is maintained by Professor Donald Rallis from the Geography Department at the University of Mary Washington (my Alma mater!). In Part 1, Professor Rallis discusses the significance of occupation of a place as a form of protest in addition to the events of the Arab Spring in Bahrain while in Part 2 he focuses specifically on the Occupy Movement in the United States.

For Outside the Neatline’s coverage of Occupy-related content, visit these posts:

Bring Geography With You When Travelling!

Many of us will be traveling this holiday season to visit family and friends and this might involve some long car, train or plane trips.  To pass the time I propose bringing some geography with you as you travel!  How is this possible?  With podcasts of course!  Here are some blog and podcasts sites that you can download as mp3’s for your trip.

Geography or (geo related) Podcasts:

Search for more at the link below:
More Free Podcasts at Online Education Database

The Impact of High Speed Rail on Accessibility in China

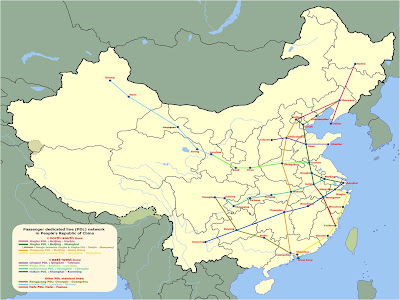
The planned National High Speed Rail Network in the People’s Republic of China.

Jie Lin, who is a colleague of mine both at the CtSDC and the Department of Geography Ph.D. program, recently examined the impacts of the planned High Speed Rail Network in the People’s Republic of China. Specifically, Jie’s focus has been on the increase in accessibility that would be a result of implementing the planned high speed network. Before we dive into Jie’s results, however,  a little background.

The total area of China is comparable to the size of the United States and the majority of that land is continuous. China has varying local physical geography that can isolate places- like the mountainous region of Tibet. Consequently, the successful implementation of a transportation network with higher travel speeds and greater accessibility has consequences in the realms of culture, the economy, and the overall social fabric of the country. Greater accessibility means the spatiotemporal size of the country decreases (ie. it takes a shorter amount of time to go from A to B, thus making A and B “closer”).

But, how does one calculate accessibility? Accessibility is defined by the ease of getting from place to place in a network. It is commonly calculated using a connectivity matrix like this:

This matrix is formed by counting how many nodes one must pass through in order to get to another node in the matrix. For example, the shortest way to go from A to E, is to pass through B, C, and E, so a 3 is added to Row A, Column E. The only difference in Jie’s study is that the calculations are not based on how many nodes one must pass through, but rather the time (in hours) it takes via the shortest route. As you can see, this measure evaluates your ability to travel from each node to each and every other node in the network.
Jie’s study, which included 31 provincial capitals and administered municipalities, was based on the following assumptions:
  • Speed of Normal Rail: 130 km/h
  • Speed of High Speed Rail: 280 km/h
Now, to Jie’s results. The units, besides the percentage column, are in hours:
And, for those of you (like me) who prefer to communicate visually, here is the resulting map. Again, units are in hours:
One of the most interesting points that I discussed with Jie is that although there are no plans for the Tibetan Region to be served by high speed rail (it is served by normal rail), the accessibility of the city of Lhasa is increased tremendously due to the improvements in other parts of the network. In fact, Lhasa has the greatest absolute change in accessibility out of any city in the study. It will be interesting to see this will affect the region culturally, economically, and socially. Overall, Jie found that the full implementation of this high speed rail network would mean an average increase in accessibility of about 50% for the cities included in the study.

A Survey of NYC’s Privately Owned Public Spaces

As of the morning November 3, 93 of the 391 privately owned public spaces had been visited.

WNYC’s Brian Leher Show and The New York World have initiated a mapping project to survey privately owned public spaces (like Zuccotti Park – home to Occupy Wall Street demonstrations) in New York City. The collaborators are asking the public to fill out a form that describes their experiences at the places. The questions include:

  • What day of the week did you visit the space?
  • What time did you visit the space?
  • Users are asked to rank the condition of the space (1-5)
  • What kinds of features define this space?
  • What kinds of activities are happening in this space?

The deadline for submissions is November 9th. The results of this project, which I look forward to seeing, should create an interesting narrative that describes what these spaces are like and how they are used, which is especially compelling in light of recent events.

Global Human Population Reaches 7 Billion

 Yesterday, it is estimated that the global human population reached 7 billion people. In response, ESRI has highlighted a map they have created that shows the world population by country. In addition to the symbology showing geographic distribution, users can also click on individual countries to access a pop-up window that shows the precise population and population graphs. If you want to know where you fit in in this world of 7 billion, check out What’s Your Number? from Population Action International.

2010 Guide to State and Local Census Geography

Ever wanted to know what the historical center for population in a state based on decennial census data? Check out the 2010 Guide to State and Local Census Geography includes a quick summary of 2010 Census data based on geography. Check out these reports at: http://www.census.gov/geo/www/guidestloc/guide_main.html

Below is a quick example of some of the data available for Connecticut

CONNECTICUT CENTERS OF POPULATION

http://www.census.gov/geo/www/2010census/centerpop2010/historical/historical_cenpop_09.html

Year North Latitude West Longitude
20106 41° 29′ 49″ 72° 52′ 13″
20006 41° 29′ 41″ 72° 52′ 28″
19905 41° 29′ 49″ 72° 52′ 10″
19804 41° 29′ 26″ 72° 52′ 34″
19703 41° 29′ 17″ 72° 52′ 38″
19603 41° 32′ 11″ 72° 53′ 00″
19503 41° 30′ 33″ 72° 52′ 57″
19402 41° 32′ 12″ 72° 53′ 29″
19302 41° 32′ 11″ 72° 53′ 22″
19201 41° 30′ 08″ 72° 51′ 47″
19101 41° 30′ 54″ 72° 50′ 20″
19001 41° 31′ 23″ 72° 49′ 06″
18901 41° 31′ 41″ 72° 48′ 00″
18801 41° 32′ 49″ 72° 46′ 21″
1  Source:  U.S. Department of Commerce, Bureau of the Census, Fourteenth Census of the United States, 1923
2  Source:  U.S. Census Bureau, recomputation for historical county level data which relied upon aggregate county level population data with an estimated county centroid resulting in a possible error of up to one mile.
3  Source:  U.S. Department of Commerce, Bureau of the Census, Centers of Population for States and Counties, 1974
4  Source:  U.S. Census Bureau, Geography Division, recomputation from archived national block group/enumeration area data resulting in a possible error of up to 1,000 feet.
5  Source:  U.S. Census Bureau, Geography Division, recomputation from archived national block group data resulting in a possible error of up to 1,000 feet.
6  Source:  U.S. Census Bureau, computation from national block-level data

Geography Awareness Week Kickoff Event – November 3, 2011 @ UConn

Geography: The Adventures in Your Community
Thursday, November 3, 2011 4:45-8:00pm
Thomas J Dodd Research Center at UConn
Storrs, Connecticut
The heart of this year’s theme will revolve around a series of topics that encourage individuals or teams of students, families, or friends to explore their own communities through geographic eyes, and challenge them to look at things from a geographic perspective.
Program Agenda
4:00-4:30 Pre-conference tour of UConn Libraries – MAGIC
4:30-4:45 Registration – Thomas J. Dodd Research Center
4:45-5:00 Welcome – Bill DeGrazia & Tom Brodnitzki, CGA Co-Coordinators
5:00-6:00 Keynote Speaker – Arthur Bakis – U.S. Census Bureau Boston Regional Office
6:05-6:55 Buffet Dinner and Remarks
7:00-7:50 Breakout Sessions
I – Elementary Teachers – Allyson Lubs, Professional Development CGA
II – Middle & High School Teachers – Kristie Blanchard, NE Geography Teacher of the Year
III – Exploration of American Community Survey (ACS) –
Michael Howser, Connecticut State Data Center
7:50-8:00 CEU Records and Drawings

Participation Fee: $25 (add $10 if you would like to be awarded .3 CEUs upon completion of the program). The fee includes registration and a light dinner. Checks should be made payable to “Connecticut Geographic Alliance.
Pre-Service Teachers receive a reduced registration fee of $10 and currently enrolled UConn Students receive free admission.
This workshop is a collaboration of the Connecticut Geographic Alliance, University of Connecticut Department of Geography, University of Connecticut Libraries Map and Geographic Information Center (MAGIC), and the Connecticut State Data Center.
To register for this event download the Registration form.