Facts for Features: Earth Day (April 22, 2014)

From the US Census Bureau:

April 22, 2014, marks the 44th anniversary of Earth Day ― a day intended to inspire awareness and appreciation for the Earth’s natural environment. The day came from reaction to a massive oil spill in waters near Santa Barbara, Calif., in 1969. In honor of Earth Day ― and Earth Week (April 16-22) ― this edition of Profile America Facts for Features includes examples of Census Bureau statistics pertaining to energy and the environment.

Heating and Cooling the Home

2.4 million
Estimated number of occupied housing units across the country heated by wood in 2012, which is 2.1 percent of all homes.

42,747
Estimated number of occupied housing units across the country totally heated by solar energy in 2012.

57.0 million
Estimated number of occupied housing units across the country heated by utility gas in 2012, which is 49.4 percent of all homes.

Source: 2008-2012 American Community Survey five-year estimates, Table B25040.
http://factfinder2.census.gov/faces/nav/jsf/pages/index.xhtml

89%
Estimated percent of newly built single-family homes across the country with air-conditioning in 2012. In 1973, it was 49 percent.

Source: 2012 Characteristics of New Housing
http://www.census.gov/construction/chars/highlights.html

Presence of Air-Conditioning in New Single-Family Houses Completed

http://www.census.gov/construction/chars/pdf/aircond.pdf

Commuting to Work

25.7 minutes
Estimated average time for workers age 16 and older across the country spent getting to work in 2012, up from 25.5 minutes in 2011 and 25.3 minutes in 2010.

31.9 and 31.8 minutes
Estimated average time for workers age 16 and older in Maryland and New York spent getting to work in 2012, the longest commute time in the nation. (The two times are not statistically different.) Maryland’s time is down from 32.2 minutes in 2011.

16.7 and 17.4 minutes
Estimated average time workers age 16 and older in South Dakota and North Dakota spent getting to work in 2012, the shortest one-way commute times in the nation. (The two times are not statistically different.)

864,883
Estimated number of people who rode a bicycle to work in 2012. This comes out to about 0.6 percent of the American workforce.

Tools to help with your demographic research or teaching

CensusBureauThe US Census Bureau offers a myriad of tools to help with your demographic research. One of the most common ways to obtain tables with the raw data, or shapefiles, is to use American FactFinder. The search on this website will allow you to type in the types of tables you are looking for (Education, Population, Median Household Income, etc.) and the geography for which you are looking (Census tracts in Connecticut, Counties, or state level). You can search for Census, American Community Survey, or other datasets. You can then download the table, or create a map and download the tables and associate shapefiles (.shp – for use in ArcGIS or other GIS software). The CT State Data Center also has some how-to videos for help with searching American FactFinder.

The Census Bureau also offers a variety of visualizations and other online maps to assist users with understanding various types of statistics. In November, a new interactive suite of visualization tools for jobs, business and other economic statistics was released.  The tool allows users to change the type of data they are interested in, and visualize the results in graph form.

There is also the Data Visualization Gallery, which provides interesting data visualizations with census data, that are published weekly. For example, see “Population Bracketology,” a game based on the NCAA March Madness bracket that allows users to compare city and state population numbers.

The Census Explorer allows the user to interactively look at datasets as a map. Some of the datasets currently included are both Census and ACS:

  • Total population
  • Percent 65 and older
  • Foreign-born population percentage
  • Percent of the population with a high school degree or higher
  • Percent with a bachelor’s degree or higher
  • Percent with a master’s degree or higher
  • Labor force participation rate
  • Percent of labor force employed in Professional, Scientific and Tech Industry
  • Home ownership rate
  • Median household income
  • Percent of households with incomes of $150,000 or higher
  • Total wage employees (excludes contractors, self-employed)
  • Tech wage employees
  • Average yearly employee wage
  • Average yearly tech employee wage
  • Total number of business establishment
  • Percent of establishments in the technology sector

Additionally, TIGER data can now be viewed in “TIGERweb4.0” a new release that according to the Census Bureau is: “TIGERweb is a web-based application that allows users to visualize the Census Bureau’s TIGER data. The applications allow users to select features and view their attributes, to search for features by name or geocode, and to identify features by selecting them from a map. The application provides a simple way to view TIGER data without having to download the data.”

Facts for Features: NCAA Final Four

A bit belated, but still relevant because tonight is the men’s final and tomorrow the women’s! Go Huskies!

From the US Census Bureau:

2014 NCAA Men’s Final Four: April 5-7

The NCAA Final Four men’s college basketball games will be played April 5 and April 7 at AT&T Stadium in Arlington, Texas. Sometimes known as March Madness or the Big Dance, the NCAA Division I Men’s Basketball Tournament has grown from an eight-team tournament in 1939 to a 68-team, single-elimination playoff with mass appeal. The semifinals and championship games are each expecting more than 100,000 fans, and about 15 million viewers are expected to watch each game on TV. To commemorate this occasion, the Census Bureau has compiled a collection of facts examining the demographics of the host city, as well as the cities represented by the four remaining teams — Madison, Wis. (University of Wisconsin), Gainesville, Fla. (University of Florida), Storrs, Conn. (University of Connecticut) and Lexington-Fayette, Ky. (University of Kentucky).

Game Trends

7
Out of the past 10 national championship games, the school from the city with a smaller population has won seven times (70 percent). Source: QuickFacts, Population Estimates and NCAA <http://quickfacts.census.gov/qfd/index.html>, <http://www.ncaa.com/final-four>

50%
Out of the past 10 years of national semifinal games, the school from the city with a smaller population has won half (10 out of 20) of the games. Source: QuickFacts, Population Estimates and NCAA <http://quickfacts.census.gov/qfd/index.html>, <http://www.ncaa.com/final-four>

Arlington, Texas (Home of AT&T Stadium, site of the Men’s Final Four)
Population: 375,600
Median household income: $53,341
Percentage completed high school or higher (25 and older): 84.2%
Percentage bachelor’s degree or higher (25 and older): 28.7%

Source: QuickFacts <http://quickfacts.census.gov/qfd/states/48/4804000.html>

Gainesville, Fla. (Home of the University of Florida Gators)
Population: 126,047
Median household income: $32,145
Percentage completed high school or higher (25 and older): 90.9%
Percentage bachelor’s degree or higher (25 and older): 43.7%

Source: QuickFacts <http://quickfacts.census.gov/qfd/states/12/1225175.html>

Storrs, Connecticut (Home of the University of Connecticut Huskies)
Population: 14,031
Median household income: $34,924
Percentage completed high school or higher (25 and older): 95.0%
Percentage bachelor’s degree or higher (25 and older): 49.4%

Source: QuickFacts and 2008-2012 American Community Survey <http://quickfacts.census.gov/qfd/states/09/0973980.html> <http://factfinder2.census.gov/faces/tableservices/jsf/pages/productview.xhtml?pid=ACS_12_5YR_B01003&prodType=table>

Madison, Wis.(Home of the University of Wisconsin Badgers)
Population: 240,323
Median household income: $53,958
Percentage completed high school or higher (25 and older): 94.8%
Percentage bachelor’s degree or higher (25 and older): 53.3%

Source: QuickFacts <http://quickfacts.census.gov/qfd/states/55/5548000.html>

Lexington-Fayette, Ky.(Home of the University of Kentucky Wildcats)
Population: 305,489
Median household income: $48,779
Percentage completed high school or higher (25 and older): 88.7%
Percentage bachelor’s degree or higher (25 and older): 39.9%

Source: QuickFacts <http://quickfacts.census.gov/qfd/states/21/2146027.html>

2014 NCAA Women’s Final Four: April 6-8

The NCAA Final Four women’s college basketball games will be played April 6 and April 8 at Bridgestone Arena in Nashville, Tenn. The NCAA Division I Women’s Basketball Tournament has been held annually since 1982; it was one of 12 women’s sports added to the NCAA championship program for the 1981-82 school year. Since 2003, the championship game has been played on the Tuesday following Monday’s men’s championship game. To commemorate this occasion, the Census Bureau has compiled a collection of facts examining the demographics of the host city, as well as the “college towns” associated with the four remaining teams — Storrs, Conn. (University of Connecticut); South Bend, Ind. (University of Notre Dame); Palo Alto, Calif. (Stanford University); and College Park, Md. (University of Maryland).

Nashville-Davidson, Tenn. (Home of Bridgestone Arena, site of the Women’s Final Four)
Population: 624,496
Median household income: $45,982
Percentage completed high school or higher (25 and older): 85.6%
Percentage bachelor’s degree or higher (25 and older): 34.3%

Source: Census Bureau QuickFacts and 2008-2012 American Community Survey
<http://quickfacts.census.gov/qfd/states/47/4752006.html>

Storrs, Conn.(Home of the University of Connecticut Huskies)
Population: 15,344
Median household income: $34,924
Percentage completed high school or higher (25 and older): 95.0%
Percentage bachelor’s degree or higher (25 and older): 49.4%

Source: Census Bureau QuickFacts and 2008-2012 American Community Survey
<http://quickfacts.census.gov/qfd/states/09/0973980.html>

South Bend, Ind.(Home of the University of Notre Dame Fighting Irish)
Population: 100,800
Median household income: $34,182
Percentage completed high school or higher (25 and older): 84.2%
Percentage bachelor’s degree or higher (25 and older): 22.8%

Source: Census Bureau QuickFacts and 2008-2012 American Community Survey
<http://quickfacts.census.gov/qfd/states/18/1871000.html>

(Note: The University of Notre Dame is technically located in unincorporated Notre Dame, Ind., CDP (census-designated place), which is adjacent to South Bend. Notre Dame, Ind., had a population of 5,973; according to the 2008-2012 American Community Survey, it had a median household income of $21,250; 96.0 percent had a high school diploma or higher; and 73.5 percent had a bachelor’s degree or more. Sources for Notre Dame CDP: Census Bureau QuickFacts  <http://quickfacts.census.gov/qfd/states/18/1855386.html>

Palo Alto, Calif.(Home of the Stanford University Cardinal)
Population: 66,363
Median household income: $122,482
Percentage completed high school or higher (25 and older): 97.6%
Percentage bachelor’s degree or higher (25 and older): 79.5%

Source: Census Bureau QuickFacts and 2008-2012 American Community Survey
http://quickfacts.census.gov/qfd/states/06/0655282.html
(Note: Most of Stanford University is located in the unincorporated Stanford, Calif., CDP, adjacent to Palo Alto. Stanford, Calif., had a population of 13,809; according to the 2008-2012 American Community Survey, it had a median household income of $55,299; 99.0 percent had a high school diploma or higher; and 92.3 percent had a bachelor’s degree or more.

Source for Stanford, CDP: Census Bureau QuickFacts: <http://quickfacts.census.gov/qfd/states/06/0673906.html>

College Park, Md. (Home of the University of Maryland Terrapins)
Population: 31,208
Median household income: $60,402
Percentage completed high school or higher (25 and older): 88.6%
Percentage bachelor’s degree or higher (25 and older): 49.0

Source: Census Bureau QuickFacts and 2008-2012 American Community Survey
<http://quickfacts.census.gov/qfd/states/24/2418750.html>

Facts for Features: Women’s History Month (March)

From the US Census Bureau:

National WoCensusBureaumen’s History Month’s roots go back to March 8, 1857, when women from New York City factories staged a protest over working conditions. International Women’s Day was first observed in 1909, but it wasn’t until 1981 that Congress established National Women’s History Week to be commemorated the second week of March. In 1987, Congress expanded the week to a month. Every year since, Congress has passed a resolution for Women’s History Month, and the President has issued a proclamation.

161 million
The number of females in the U.S. as of December 2013. The number of males was 156.1 million. Source: U.S. Census Bureau, Monthly Postcensal Resident Population: 7/1/2013 – 12/1/2013 http://www.census.gov/popest/data/national/asrh/2012/2012-nat-res.html

2 to 1
At 85 and older, the approximate ratio by which women outnumbered men in 2012 (3.9 million to 2.0 million). Source: U.S. Census Bureau, Population Estimates http://factfinder2.census.gov/faces/tableservices/jsf/pages/productview.xhtml?pid=PEP_2012_PEPAGESEX&prodType=table

Jobs

75 million
The number of females 16 and older who participated in the labor force in 2012. Women comprised 47.2 percent of the labor force in 2012. Source: U.S. Census Bureau, 2012 American Community Survey, DP03 http://factfinder2.census.gov/bkmk/table/1.0/en/ACS/12_1YR/DP03

41.6%
Percent of employed females 16 and over in 2012 (annual average) who worked in management, professional and related occupations, compared with 34.7 percent of employed males in the same year (annual average). Source: U.S. Bureau of Labor Statistics, Current Population Survey http://www.bls.gov/cps/cpsaat09.htm

Military

1.6 million
Number of female veterans in the United States in 2012. Source: 2012 American Community Survey http://factfinder2.census.gov/bkmk/table/1.0/en/ACS/12_1YR/B21001/0100000US

Earnings

$37,791
The median annual earnings of women 15 or older who worked year-round, full time in 2012. In comparison, the median annual earnings of men were $49,398. Source: Income, Poverty, and Health Insurance Coverage in the United States: 2012, Page 7. http://www.census.gov/prod/2013pubs/p60-245.pdf

77¢
The amount that female year-round, full time workers earned in 2012 for every dollar their male counterparts earned. This ratio was statistically unchanged from 2011. Source: Income, Poverty, and Health Insurance Coverage in the United States: 2012, Page 11. http://www.census.gov/prod/2013pubs/p60-245.pdf

Education

11.3 million
Number of women college students in fall 2012. Women comprised 56.8 percent of all college students. Source: School Enrollment in the United States: 2012, Table 5 http://www.census.gov/hhes/school/data/cps/2012/tables.html

31.4
Percent of women 25 and older who had obtained a bachelor’s degree or more as of 2013. Source: Educational Attainment in the United States: 2012, Table 3 http://www.census.gov/hhes/socdemo/education/data/cps/2013/tables.html

25%
Percentage of women 18 and older with an alternative educational credential — such as professional certifications, licenses and educational — not statistically different from men. However, women had higher rates of alternative credentials than men at the bachelor’s degree and advanced degree levels. Source: Measuring Alternative Educational Credentials: 2012 http://www.census.gov/prod/2014pubs/p70-138.pdf

15%
Among people with advanced degrees, the percentage of women who held educational certificates compared with 12 percent of men; 51 percent of women held professional certifications or licenses compared with 43 percent of men. Source: Measuring Alternative Educational Credentials: 2012 http://www.census.gov/prod/2014pubs/p70-138.pdf

Voting

63.7%
Percentage of female citizens 18 and older who reported voting in the 2012 presidential election, in comparison to 59.7 percent of their male counterparts. Source: Voting and Registration in the Election of November 2012, Table 2 http://www.census.gov/hhes/www/socdemo/voting/publications/p20/2012/tables.html

Motherhood

85.4 million
Estimated number of mothers in the U.S. in 2009. Source: Unpublished data from the Survey of Income and Program Participation

1.9
Average number of children that women 40 to 44 had given birth to as of 2010, down from 3.1 children in 1976, the year the Census Bureau began collecting such data. Source: Fertility of American Women: 2010 table 2 and Historical table 2 http://www.census.gov/hhes/fertility/data/cps/
The percentage of women in this age group who had given birth was 81 percent in 2010, down from 90 percent in 1976. Source: Fertility of American Women: 2010 table 1 and Historical table 2 http://www.census.gov/hhes/fertility/data/cps/

Marriage

66 million
Number of married women 18 and older (including those who were separated or had an absent spouse) in 2013. Source: Families and Living Arrangements: 2013, Table A1 http://www.census.gov/hhes/families/files/cps2013/tabA1-all.xls

5.2 million
Number of stay-at-home mothers nationwide in 2013; compared with 214,000 stay-at-home fathers. Source: Families and Living Arrangements: 2013, Table FG8 http://www.census.gov/hhes/families/files/cps2013/tabFG8-all.xls

Facts for Features: Irish Heritage Month & St. Patrick’s Day

From the US Census Bureau:

Irish-American Heritage Month (March)

Originally a religious holiday to honor St. Patrick, who introduced Christianity to Ireland in the fifth century, St. Patrick’s Day has evolved into a celebration for all things Irish. The world’s first St. Patrick’s Day parade occurred on March 17, 1762, in New York City, featuring Irish soldiers serving in the English military. This parade became an annual event, with President Truman attending in 1948. Congress proclaimed March as Irish-American Heritage Month in 1995, and the President issues a proclamation commemorating the occasion each year.

Sports Celebration of Irish Heritage

100,003

Population of South Bend, Ind., home to the Fighting Irish of the University of Notre Dame. About 10.4 percent of South Bend’s population claims Irish ancestry.

Source: 2012 American Community Survey http://factfinder2.census.gov/bkmk/table/1.0/en/ACS/12_1YR/DP02/1600000US1871000

24.1%

Percentage of the Boston metropolitan area population that claims Irish ancestry, one of the highest percentages for the top 50 metro areas by population. Boston is home of the Celtics of the National Basketball Association.

Source: 2012 American Community Survey http://factfinder2.census.gov/bkmk/table/1.0/en/ACS/12_1YR/DP02/310M100US14460

78,390 and 16,167
Population of New Rochelle, N.Y., and Moraga, Calif., home to the Gaels of Iona University and St. Mary’s College of California, respectively. During college basketball’s March Madness, you will typically see these universities compete on the court, no doubt rooted on by some of the 8.4 percent of the New Rochelle population and 15.5 percent of the Moraga population that claim Irish ancestry.

Sources: 2012 American Community Survey http://factfinder2.census.gov/bkmk/table/1.0/en/ACS/12_1YR/DP02/1600000US3650617
http://factfinder2.census.gov/bkmk/table/1.0/en/ACS/12_5YR/DP02/1600000US0649187

Population Distribution

34.1 million

Number of U.S. residents who claimed Irish ancestry in 2012. This number was more than seven times the population of Ireland itself (4.6 million). Irish was the nation’s second most frequently reported ancestry, trailing only German.

Sources: 2012 American Community Survey http://factfinder2.census.gov/bkmk/table/1.0/en/ACS/12_1YR/S0201/0100000US/popgroup~541

Ireland Central Statistics Office http://www.cso.ie/en/media/csoie/releasespublications/documents/statisticalyearbook/2013/c1population.pdf

22.6%

Percentage of the population in Massachusetts that claims Irish ancestry, which is among the highest in the nation. New York has 2.5 million people claiming Irish ancestry, which is among the most of any state.

Source: 2012 American Community Survey http://factfinder2.census.gov/bkmk/table/1.0/en/ACS/12_1YR/DP02/0100000US.04000

153,248

Number of people with Irish ancestry who were naturalized citizens in 2012.

Source: 2012 American Community Survey http://factfinder2.census.gov/bkmk/table/1.0/en/ACS/12_1YR/S0201/0100000US/popgroup~541

39.2 years old
Median age of those who claim Irish ancestry, which is higher than U.S. residents as a whole at 37.4 years.

Source: 2012 American Community Survey http://factfinder2.census.gov/bkmk/table/1.0/en/ACS/12_1YR/S0201/0100000US/popgroup~541

Irish-Americans Today

34.2%

Percentage of people of Irish ancestry, 25 or older, who had a bachelor’s degree or higher. In addition, 93.4 percent of Irish-Americans in this age group had at least a high school diploma. For the nation as a whole, the corresponding rates were 29.1 percent and 86.4 percent, respectively.

Source: 2012 American Community Survey http://factfinder2.census.gov/bkmk/table/1.0/en/ACS/12_1YR/S0201/0100000US/popgroup~541

$59,220

Median income for households headed by an Irish-American, higher than the $51,371 for all households. In addition, 7.4 percent of family households of Irish ancestry were in poverty, lower than the rate of 11.8 percent for all Americans.

Source: 2012 American Community Survey http://factfinder2.census.gov/bkmk/table/1.0/en/ACS/12_1YR/S0201/0100000US/popgroup~541

41.1%

Percentage of employed civilian Irish-Americans 16 or older who worked in management, professional and related occupations. Additionally, 25.9 percent worked in sales and office occupations; 15.9 percent in service occupations; 9.3 percent in production, transportation and material moving occupations; and 7.7 percent in natural resources, construction and maintenance occupations.

Source: 2012 American Community Survey http://factfinder2.census.gov/bkmk/table/1.0/en/ACS/12_1YR/S0201/0100000US/popgroup~541

68.9%

Percentage of householders of Irish ancestry who owned the home in which they live, with the remainder renting. For the nation as a whole, the homeownership rate was 63.9 percent.

Source: 2012 American Community Survey http://factfinder2.census.gov/bkmk/table/1.0/en/ACS/12_1YR/S0201/0100000US/popgroup~541

Places to Spend the Day

16

Number of places in the United States that share the name of Ireland’s capital, Dublin. The most recent population for Dublin, Calif., was 47,156.

Source: 2012 Population Estimates http://factfinder2.census.gov/bkmk/table/1.0/en/PEP/2012/PEPANNRES/0400000US06.1620

If you’re still not into the spirit of St. Paddy’s Day, then you might consider paying a visit to Emerald Isle, N.C., with 3,669 residents.

Source: 2012 Population Estimates http://factfinder2.census.gov/bkmk/table/1.0/en/PEP/2012/PEPANNRES/0400000US37.16200

Other appropriate places in which to spend the day: the township of Irishtown, Ill., several places or townships named Clover (in South Carolina, Illinois, Minnesota, Pennsylvania and Wisconsin) or one of the seven places that are named Shamrock.

The Celebration

25.9 billion

U.S. beef production in pounds in 2012. Corned beef is a traditional St. Patrick’s Day dish.

Source: USDA National Agricultural Statistics Service http://www.ers.usda.gov/news/BSECoverage.htm

$21.5 million

Value of potted florist chrysanthemum sales at wholesale in 2012 for operations with $100,000 or more sales. Lime green chrysanthemums are often requested for St. Patrick’s Day celebrations.

Source: USDA National Agricultural Statistics Servicehttp://usda01.library.cornell.edu/usda/current/FlorCrop/FlorCrop-04-25-2013.pdf

Facts for Features: Valentine’s Day

From the US Census Bureau:

Valentine’s Day 2014: Feb. 14

Expressing one’s love to another is a celebrated custom on Valentine’s Day. Sweethearts and family members present gifts to one another, such as cards, candy, flowers and other symbols of affection. Opinions differ as to who was the original Valentine, but the most popular theory is that he was a clergyman who was executed for secretly marrying couples in ancient Rome. In A.D. 496, Pope Gelasius I declared Feb. 14 as Valentine Day. Esther Howland, a native of Massachusetts, is given credit for selling the first mass-produced valentine cards in the 1840s. The spirit continues today with even young children exchanging valentine’s cards with their fellow classmates.

Candy

1,148

Number of U.S. manufacturing establishments that produced chocolate and cocoa products in 2011, employing 35,538 people. California led the nation with 122 of these establishments, followed by Pennsylvania, with 109. Source: U.S. Census Bureau, County Business Patterns: 2011, NAICS code (31132) and (31133), http://factfinder2.census.gov/bkmk/table/1.0/en/BP/2011/00A1//naics~31132 and http://factfinder2.census.gov/bkmk/table/1.0/en/BP/2011/00A1//naics~31133

440

Number of U.S. establishments that manufactured nonchocolate confectionary products in 2011. These establishments employed 19,198 people. California led the nation in this category with 56 establishments. Source: U.S. Census Bureau, County Business Patterns: 2011, NAICS code (31134) http://factfinder2.census.gov/bkmk/table/1.0/en/BP/2011/00A1//naics~31134

$13.5 billion

The estimated value of shipments in 2011 for firms producing chocolate and cocoa products. Source: U.S. Census Bureau, 2011 Annual Survey of Manufactures, Products and Service Codes (311320 and 311330) http://factfinder2.census.gov/bkmk/table/1.0/en/ASM/2011/31VS201//prodsvc~311320|311330

Nonchocolate confectionery product manufacturing, meanwhile, was an estimated $8.4 billion industry. Source: U.S. Census Bureau, 2011 Annual Survey of Manufactures, Products and Service Code (311340) http://factfinder2.census.gov/bkmk/table/1.0/en/ASM/2011/31VS201//prodsvc~311340

3,320

Number of confectionery and nut stores in the United States in 2011. Source: U.S. Census Bureau, County Business Patterns, NAICS code (445292) http://factfinder2.census.gov/bkmk/table/1.0/en/BP/2011/00A1//naics~445292

Flowers

15,307

The total number of florists’ establishments nationwide in 2011. These businesses employed 66,165 people. Source: U.S. Census Bureau, County Business Patterns, NAICS code (4531)http://factfinder2.census.gov/bkmk/table/1.0/en/BP/2011/00A1//naics~4531

$280,357,058

The value of imports for cut flowers and buds for bouquets in 2013 through October. The total value of fresh cut roses as of October 2013 was $354,703,231. Source: U.S. Census Bureau: Foreign Trade Division USA Trade Online U.S. Import and Export Merchandise trade (Commodity code-060319)https://usatrade.census.gov/

Jewelry

23,394

The estimated number of jewelry stores in the United States in 2011. Jewelry stores offer engagement, wedding and other rings to couples of all ages. In February 2013, these stores sold an estimated $2.8 billion in merchandise. Sources: U.S. Census Bureau, County Business Patterns, NAICS code (448310) http://factfinder2.census.gov/bkmk/table/1.0/en/BP/2011/00A1/0100000US/naics~448310 and Monthly Retail Trade and Food Services http://www.census.gov/retail

The merchandise at these locations could well have been produced at one of the nation’s

1,385 jewelry-manufacturing establishments.

Source: U.S. Census Bureau, County Business Patterns, NAICS code (339911) http://factfinder2.census.gov/bkmk/table/1.0/en/BP/2011/00A1/0100000US/naics~339911

“Please Be Mine”

29.0 and 26.6 years

Median age at first marriage in 2013 for men and women, respectively. Source: U.S. Census Bureau, Families and Living Arrangements: 2013, http://www.census.gov/hhes/families/data/marital.html Table MS-2

52.7%

The overall percentage of people 15 and older who reported being married. Source: U.S. Census Bureau, Families and Living Arrangements: 2013, http://www.census.gov/hhes/families/data/cps2013A.html Table A1

68.6%

Percentage of people 15 and older in 2013 who had been married at some point in their lives — either currently or formerly. Source: U.S. Census Bureau, Families and Living Arrangements: 2013, http://www.census.gov/hhes/families/data/cps2013A.html Table A1

36.9

The provisional rate of marriages per 1,000 people performed in Nevada during 2011. So many couples tie the knot in the Silver State that it ranked number one nationally in marriage rates. Hawaii ranked second with a marriage rate of 17.6. Source: National Center for Health Statistics, http://www.cdc.gov/nchs/data/dvs/marriage_rates_90_95_99-11.pdf

2.1 million

The provisional number of marriages that took place in the United States in 2011. That breaks down to nearly 5,800 a day. Source: National Center for Health Statistics, http://www.cdc.gov/nchs/nvss/marriage_divorce_tables.htm

74.5%

The percentage of women who married for the first time between 1990 and 1994, who marked their 10th anniversary. This compares with 83 percent of women who married for the first time between 1960 and 1964. Source: U.S. Census Bureau, Number, Timing, and Duration of Marriages and Divorces: 2009, http://www.census.gov/prod/2011pubs/p70-125.pdf Table 4

6.2%

As of 2009, the percentage of currently married women who had been married for at least 50 years. A little more than half of currently married women had been married for at least 15 years. Source: U.S. Census Bureau, Number, Timing, and Duration of Marriages and Divorces: 2009 http://www.census.gov/prod/2011pubs/p70-125.pdf Table 9

Giving Love a Second Chance

19.4%

Among people 15 and older who have been married, the percentage of men and women, who have been married twice as of 2012. Five percent have married three or more times. By comparison, 75.4 percent of people who have ever been married have made only one trip down the aisle. Source: 2012 American Community Survey http://factfinder2.census.gov/bkmk/table/1.0/en/ACS/12_1YR/B12505

8

Median length, in years, of first marriages that ended in divorce. Source: Number, Timing, and Duration of Marriages and Divorces: 2009 http://www.census.gov/prod/2011pubs/p70-125.pdf Table 8

3.8 and 3.7

The median time in years between divorce and a second marriage for men and women, respectively. However, the two medians are not statistically different from each other. Source: Number, Timing, and Duration of Marriages and Divorces: 2009 http://www.census.gov/prod/2011pubs/p70-125.pdf Table 8

9% and 7.9%

Among people 15 and older in 2009, the percentage of men and women, respectively, who had married twice and were still married. Source: Number, Timing, and Duration of Marriages and Divorces: 2009 http://www.census.gov/prod/2011pubs/p70-125.pdf Table 6

Looking for Love

393

The number of dating service establishments nationwide as of 2007. These establishments, which include Internet dating services, employed 3,125 people and pulled in $928 million in revenue. Source: U.S. Census Bureau, 2007 Economic Census http://factfinder2.census.gov/bkmk/table/1.0/en/ECN/2007_US/00A1//naics~8129902

Source: U.S. Census Bureau, American FactFinder http://factfinder2.census.gov

Connecticut Census Tract Data Browser for American Community Survey Data

Census Tracts, statistical areas of roughly three to seven thousand individuals, are the smallest practical geography for analysis using American Community Survey estimate data. In Connecticut many smaller towns have a single Census Tract, while larger cities can have more than a dozen.The Census Bureau’s American FactFinder data tool provides more than 3,500 different tables of data from the American Community Survey for Census Tracts on a wide range of topics. While the organization, documentation, downloading capabilities of American FactFinder are extremely sophisticated, it can be difficult to identify and select particular Census Tract for analysis – say, those in the northern portion of Hartford – without already being familiar with the boundaries of the tracts. (While this can be done using the Reference Map interface in American FactFinder, it is a fairly cumbersome process).

The shaded map of Census Tracts below allows the user to select single or multiple tracts for analysis, and takes advantage of the deep linking capabilities of American FactFinder.  By holding down the Control key, multiple tracts can be selected with the mouse. The links to demographic, economic, and other data which then appear in the mouseover ‘Tooltip’ menu can be a starting point for exploring additional data for the selected tracts, because the geographies chosen remain selected in the resulting American FactFinder session. Upon following the link in the Tooltip to a table in American FactFinder, click the Advanced Search tab above the table to return to the American FactFinder search screen, to browse among the thousands of tables of data for the tract(s), using a keyword search or the Topics menu.

[xyz-ihs snippet=”Census-Tract-Data-Browser”]

Gini Index of Income Inequality for U.S. Counties

This visualization displays U.S. Census Bureau American Community Survey Gini index estimates for U.S. counties.  The Census Bureau defines the Gini index as “a statistical measure of income inequality ranging from 0 to 1. A measure of 1 indicates perfect inequality, i.e., one household having all the income and rest having none. A measure of 0 indicates perfect equality, i.e., all households having an equal share of income.” For an analysis of the ACS Gini index data, see the Census Brief: Houshold Income Inequality Within U.S. Counties.

The visualization allows the viewer to filter the counties displayed on the map by Gini index. Links into American FactFinder from the mouseover Tooltip for each county on the map provide further economic data including median household income, poverty, and insurance coverage data for the county.


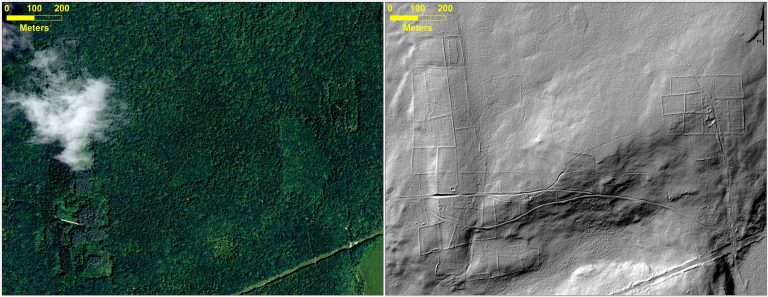
“Lost” New England landscape found using LiDAR

magic_all

At top left, leaf-on 2012 aerial imagery from Connecticut (CTECO); top right is 2010 hillshaded DEM derived from LiDAR data showing stone walls, old road and building foundation; bottom is 1934 aerial photography (available from MAGIC and CT State Library)


New research by Geography graduate student Katharine Johnson and faculty William Ouimet was covered yesterday by National Geographic in their article “Lost” New England Revealed by High-Tech Archaeology. The article features a Q & A with Katharine Johnson, a PhD student in Geography and employee here at MAGIC and the Connecticut State Data Center.

You can read it (and see some cool graphics) here: http://news.nationalgeographic.com/news/2014/01/140103-new-england-archaeology-lidar-science

The article references a paper by Johnson and Ouimet that was recently accepted and published by the Journal of Archaeological Science about using Light Detection and Ranging (LiDAR) to identify and analyze the historic agricultural landscape of New England that is now hidden by the forest canopy in aerial photography but is visible using LiDAR. Check it out, here:  http://www.sciencedirect.com/science/article/pii/S0305440313004342

Sources of home heating used by Connecticut households

As Connecticut braces for arctic-like weather in the coming days, various energy sources will be used to heat our homes. The American Community Survey data collects on what home heating fuel sources are used in the state – fuel oil, grid-connected natural gas, electricity, wood, etc. Among Connecticut households, the majority (about 644,000) use fuel oil of some type, followed by households using utility gas (i.e. connected to street lines) – about 432,000 households – and electricity in 206,000 households. Wood is used by about 26,000 households in Connecticut, and its use is especially prevalent in the northeast corner of the state.

Use the Heating Source filter to display the use of that energy source across Census tracts in the state.