CT ECO News and Updates

Connecticut Ecological Conditions Online (CT ECO) has recently updated their data and image services and offerings! Included below is an update from CT ECO as of August 3, 2011, which includes new links to aerial photography image services for ArcGIS Users:

  • Updated Data: Aquifer Protection Area information was updated in the Map Catalog, Simple Map Viewer, Advanced Map Viewer, and for GIS and AutoCAD users, the Water Resource Management map service.
  • Updated Data: Natural Diversity Data Base Area information was updated in the Map Catalog, Simple Map Viewer, Advanced Map Viewer, and for GIS desktop software users, the Habitat map service. The date of the new information is July 2011.
  • Updated Data: Surface Water Quality Classification information was updated in the Map Catalog, Simple Map Viewer, Advanced Map Viewer, and for ArcGIS Desktop software and AutoCAD users, the Water Resource Management map service.
  • New Viewer: CT ECO Aerial Photo Viewer is for viewing and printing statewide and regional orthophotography available for Connecticut.
    Select to open the Aerial Photo Viewer
  • For Map Service users, URLs to othophotography image services have been changed to a different server (ctecoapp3).
    1. Use http://www.ctecoapp3.uconn.edu/arcgis/services to connect to othophotography.
      Image Service NEW ArcGIS Server Image Service URL
      Ortho 1990 http://www.ctecoapp3.uconn.edu/arcgis/services/images/ortho_1990
      Ortho 2004 http://www.ctecoapp3.uconn.edu/arcgis/services/images/ortho_2004
      Ortho 2006 NAIP Color http://www.ctecoapp3.uconn.edu/arcgis/services/images/ortho_2006_Color_NAIP
      Ortho 2008 NAIP 4Band http://www.ctecoapp3.uconn.edu/arcgis/services/images/ortho_2008_4Band_NAIP
      Ortho 2010 NAIP 4Band http://www.ctecoapp3.uconn.edu/arcgis/services/images/ortho_2010_4Band_NAIP
      Ortho 2008 Urban Area Color http://www.ctecoapp3.uconn.edu/arcgis/services/images/ortho_2008_color_urban_area
      Ortho 2009 Color CRCOG http://www.ctecoapp3.uconn.edu/arcgis/services/images/ortho_2009_Color_CRCOG
      Ortho 2004 Coast Color http://www.ctecoapp3.uconn.edu/arcgis/services/images/ortho_2004_Coast_Color
      Ortho 2004 Coast Infrared http://www.ctecoapp3.uconn.edu/arcgis/services/images/ortho_2004_Coast_Infrared
    2. The following image services are in the process of being re-created in ArcGIS 10 and is currently not available. They will be made available as soon as possible. We apologize for any inconvenience this may cause.
      Image Service NEW ArcGIS Server Image Service URL
      Ortho 2005 Coast Infrared http://www.ctecoapp3.uconn.edu/arcgis/services/images/ortho_2005_Coast_Infrared
      Ortho 2010 Coast Infrared http://www.ctecoapp3.uconn.edu/arcgis/services/images/ortho_2010_Coast_4Band
  • Outside the Neatline Enters its 3rd Year

    Happy 2nd Birthday to Outside the Neatline! What began as a side project by graduate students in the UConn Department of Geography and MAGIC, has blossomed into a dependable resource for geospatial news, historical maps, tech tips and more for the UConn community and beyond. A special thanks all of our contributors, past and present, for the blog’s continued success. Also, thanks to our readers. We hope you will continue to enjoy our content!
    To commemorate this occasion, here are some of our top posts.
    Top 10 Posts by Traffic:
    Here are some of the MAGIC Staff and Outside the Neatline Contributors’ Picks:

    Aerial Photography of Connecticut

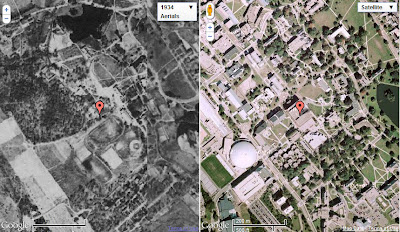
    On the left, UConn (Storrs Campus) in 1934; on the right UConn (Storrs Campus) present-day.

    A recent blog post highlighted the new GIS Data Distribution Page on MAGIC’s website. In addition to the new look on this page, the Aerial Photography Page has been updated as well! Now, when you visit this page, you will find aerial photography of Connecticut from the following sources:

    • Connecticut Ecological Conditions Online (CT ECO) Aerial Photography Viewer
    • Connecticut Historical Aerial Imagery from MAGIC
    • Connecticut Historical Aerial Photography from the Connecticut State Library
    • Connecticut Historical Aerial Photography Mosaic Map Mash-Ups from MAGIC
    A Screenshot from MAGIC’s CT Aerial Photography Mosaics Mash-Ups. The red marker indicates our location, Homer Babbidge Library. On the left, imagery from 1934, and to the right, Google’s current imagery.
    The Connecticut Aerial Photography Mosaic Mash-Ups enable you to view, pan and zoom linked historical (1934, 1991, 2006, or 2008) and and contemporary imagery…check it out!

    ESRI to Offer Free Half-Day Seminar Starting in September

    A ESRI seminar entitled Extend the Reach of Your GIS will be offered in Hartford October 6 and  in cities nationwide beginning in September.

    ESRI will be offering a free half-day seminar entitled Extend the Reach of Your GIS, this September through November, in cities all across the country. This seminar is a part of the Success with GIS Series, which aims to help users “makes the most of their existing ArcGIS software”. The only seminar being offered in the state of Connecticut is in Hartford on October 6, 2011. Click here for a complete list of locations nationwide.

    New York New Haven Hartford Railroad Valuation Maps

    Years ago the New Haven Railroad Historical and Technical Association donated 3,000 +  railroad valuation maps to the Thomas J. Dodd Research Center at the University of Connecticut.  These maps depict the rail line and features adjacent from 1915 – 1916 for the states of Connecticut, Rhode Island, Massachusetts, and New York.

    Since the maps were donated a stream of graduate students and staff, both at the Thomas J. Dodd Research Center and at MAGIC, have been scanning these maps, georeferencing them and creating a comprehensive index.  The most notable of these graduate students at MAGIC was Dean Chauvin.  Dean wrote a technical article describing the process which was the basis for all future work on this project.  Dean, I know I speak for the graduate students that came after you when I say thank you for your foresight in documenting your efforts in such a clear way! Additionally, if your Python savy, there are some nifty scripts that automate large parts of this process included in the appendices of Dean’s article.

    MAGIC has recently released the index for the New York New Haven Hartford Railroad Valuation Maps in the following formats: Google Maps Preview, Google Earth KML file, Shapefiles, and CSV (Figure 1).

    Figure 1

    Below is a screen capture of the Google Map Preview (Figure 2).  Clicking on the image will take you directly to the interactive map. You can search any place in Connecticut and by clicking on any bounding box the resulting balloon you will give the option to view the digital scan of the original map from the Thomas J. Dodd Research Center.
    Figure 2

    Currently only Connecticut is available through MAGIC in this specific format.  I know the staff of MAGIC is working tirelessly at getting the remaining state indices online and once they become available we’ll let you know.

    Cross- posted to Model Trains & Geography

    MAGIC’s GIS Data Distribution Page Has New Look

    MAGIC’s GIS Data Page has new Data Categories

    MAGIC’s GIS Data Webpage was recently given a makeover! Data is now organized in the following categories:

    The downloadable GIS data on MAGIC’s page has been reorganized for better usability.
    In addition, the downloadable data has changed. You will find Metadata, Spreadsheet data, Shapefiles, KML’s and a Map Preview option which allows you to preview data in Google Maps. Shapefiles are now conveniently compressed; .zip files now include statewide (or applicable geography-wide) data. Three different shapefiles are included in each compressed file; each with a different coordinate system (Connecticut NAD83 feet, NAD83 meters and WGS84, respectively). 

    Integrating Spatial Thinking in the Classroom

    A recent Outside the Neatline post describes how spatial thinking and analysis is becoming ever more pervasive throughout the Humanities Community. Much of the reason why geospatial applications are spreading is because the general public has become accustomed to the related technology. The way in which Google Earth & and Maps, GPS technology and other geospatial products have permeated our society is allowing a younger generation to gain unprecedented familiarity with what was- not so long ago- considered cutting-edge technology. So with a new school year approaching, how can we, as educators, supplement this growing familiarity advantageously to improve students’ cognitive abilities?

    Picture This by Nora Newcombe (American Educator Summer 2010) presents a road map of how improved spatial thinking often leads to improved math and science ability.

    Citing the importance of being able to visualize our world, this article, from American Educator (Summer 2010), discusses the intimate connection between spatial thinking and the STEM disciplines . One example the author, Nora S. Newcombe, describes is how Albert Einstein’s parietal cortex (the area of the brain used for spatial and mathematical thinking) was found to be abnormally large and oddly configured which could have led to his novel ability to imagine and describe our universe.

    There are many tools to improve spatial thinking such as computer games that require visualization- like Tetris.

    Obviously not everyone is an “Einstein”. In light of this, Newcombe stresses that everyone, with very rare exceptions, can improve their ability to think spatially starting at an early age. For preschool aged students, she recommends such things as having children do jigsaw puzzles, teaching spatial words (out, in, middle, above, next to, etc.) and beginning to use maps and models of the world with children as young as three. As students become older, the repertoire available to improve spatial thinking expands to include even computer games that include visualization- like Tetris.

    This screenshot shows a Google Lit Trip of The Odyssey by Homer.

    Geospatial software can easily be incorporated into the classroom and give educators an opportunity to create interdisciplinary and dynamic lesson plans that improve students’ ability to think spatially. Google Lit Trips, which synthesizes literature and geography, is a perfect example of this. Follow the links below for more educational resources for integrating geospatial technology and thought in the classroom:

    Connecticut Geographic Alliance Lesson Plans – Lesson plans for a variety of ages that include geographic thought.

    ESRI Education Community – ESRI, is a global leader in geospatial software, hosts this community site. Be sure to visit the ArcLessons page!

    Fieldscope – A National Geographic Project that uses web-based observations and analysis to encourage outdoor education activities. Video tutorials included!

    Geospatial Revolution – Geospatial Revolution is a public outreach project by Penn State. The link provided is to their For Educators page.

    Race Restrictive Covenants in Hartford area, 1940s: A Map with Linked Documents

    This is the fourth in a series of posts on web-based maps developed by the University of Connecticut Libraries Map and Geographic Information Center (MAGIC) for the On The Line project.

    Today’s posting on interactive maps showcases the Race Restrictive Covenants in Property Deeds, Hartford area, 1940s, which exemplifies the use of Geospatial technologies in the humanities. Geospatial technology allows us to show historic data in new and interesting ways and enables the user to see the data from a new perspective. Working with Professor Jack Dougherty at Trinity College, MAGIC developed this digital map as part of the On The Line project, a public history of schooling, housing, and civil rights in the Hartford metropolitan region.

    Click image to explore our Race Restrictive Covenants Map

    Restrictive covenants are barriers — typically against African-Americans, Jews, or Catholics — that were written into property deeds by individual home owners or real estate developers, to legally block them from owning or occupying housing. In 1921, the U.S. Supreme Court affirmed the right of private property owners to insert these restrictions, but when challenged by civil rights organizations such as the NAACP, it eventually ruled in the 1948 Shelley v Kraemer case that these restrictions were no longer enforceable by governmental authority. Yet restrictive language still exist in the legal paper trail of property records. Based on their search of property records in West Hartford, Professor Dougherty and a Trinity student researcher, Katie Campbell, so far have found 5 examples of racial restrictive covenants in suburban housing developments from the early 1940s. Click the map above to see the location of each covenant, with a link to scanned source document.

    For example, the developer of High Ledge Homes, located near South Main Street in West Hartford, inserted this restriction when filing the property deed in June 1940:

    “No persons of any race except the white race shall use or occupy any building on any lot except that this covenant shall not prevent occupancy by domestic servants of a different race employed by an owner or tenant.”


    While students generally learn about the history of segregation in Southern and border states, this map reveals a hidden chapter in our history of the North. Racially restrictive covenants have been extensively documented in other northern cities, such as Chicago, Detroit, and Seattle. In their digital history website, the Seattle Civil Rights and Labor History Project, students and faculty from the University of Washington built community awareness that helped to pass a 2006 state law making it easier for homeowners associations to rid themselves of these historical racial covenants.

    Within the Hartford region, can you help us find other examples of restrictive covenants by race, religion, or nationality? Do you recall seeing or hearing about similar barriers in the property deed of a family member or neighbor? If so, please post a comment on the On The Line website or contact MAGIC via email.

    Technical Detail:

    The cartographic layer for the Race Restrictive Covenants in Hartford area, 1940s: A Map with Linked Documents map was created using ESRI’s ArcMap software. Professor Dougherty and Katie Campbell from Trinity College located housing development deeds in West Hartford, CT containing restrictive language.

    Using the deeds, we digitized the location of housing developments that contained restrictive covenants, and then exported the shapefile as a KMZ file using ArcGIS ArcToolbox conversion tool. We then edited the individual pop-up balloons using Google Earth and added HTML code to link PDF documents of the property deeds and to improve the overall display of the data, and then this layer was saved as a KMZ file. This is similar to the customization of the Redlining in Hartford KMZ discussed in a previous blog posting. We also integrated a point file for each housing development with restrictive covenants in West Hartford, CT to enhance the geographic visibility of the five developments.

    The linked documents map utilizes the Google Maps JavaScript API V3 and custom javascript code by Ben Spaulding and Thomas Bachant. The interactive map interface overlays our content on a Google Maps interface.

    Coming next in this series — Home Value Index in the Hartford Region, 1910-2007: An Animated Time Slider Map

    UN to Establish Committee on Global Geospatial Information

    Last week, the United Nations Economic and Social Council (ECOSOC) voted to establish a committee of experts to manage international cooperation regarding geospatial infrastructure. This press release highlights the diverse applications of GIS for the UN including analyzing climate change, natural disaster response and preparedness as well as managing population displacement, food and economic crises and pandemics. For more, visit the United Nations Initiative on Global Geospatial Information Management.

    A Spatial Revolution in the Humanities

    Geospatial Technology, particularly in the past decade, has become more intuitive and user-friendly. This, in turn, has catalyzed the growth of a community of users that span a wide range of disciplines. Here, at the University of Connecticut Libraries’ Map and Geographic Information Center (MAGIC), much of what we work on is related to producing or preserving historical spatial data. This includes digitizing and georeferencing historical maps, producing cartographic layers from historical census data and making historical aerial imagery available to the public. We hope that by doing this, we can not only be of service to the traditional users of GIS, but also to those who are breaking new ground and finding novel applications for spatial analysis.

    A Viewshed Analysis showing General Robert E. Lee’s perspective on the second day of fighting at Gettysburg. This recent NYT article describes research done at Middlebury College by Geographer Anne Kelly Knowles

    The disciplines comprising the humanities, including but not limited to Anthropology, History, and Literature, have recently shown an affinity toward employing spatial analysis techniques. This New York Times article has received much attention lately, as it highlights the use of GIS by scholars to improve their understanding of historical events (such as Gettysburg and The Dust Bowl). A project at the University of Virginia Library, entitled Spatial Humanities, works to encourage this integration of spatial technology in the humanities. In May 2010, the UVA Library hosted an event “The Scholars’ Lab/NEH Institute for Enabling Geospatial Scholarship”. Follow this link to view two minute, three slide Lightning Talks from this event for more examples of spatial humanities projects and works in progress.

    Spatially-enabling the humanities is not limited to scholars, however, and Google products have become a great tool for integrating a spatial dynamic for K-12. Google Lit Trips, which is a project that compiles cartographic layers related to Literature, is a great example of this.

    At the University of Connecticut, we hope to do our part in contributing to this digitally-enabled spatial revolution in the humanities. Over the past two years, MAGIC has worked closely with Professor Jack Dougherty from Trinity College to produce cartographic products for On The Line: How Schooling, Housing and Civil Rights Shaped Hartford and its Suburbs.

    Redlining, or discriminatory lending practices by geographic area, was a driving factor that shaped the Hartford Region. MAGIC helped to produce cartographic layers for On The Line that visually portray these policies.
    This web book, supported by a grant from the National Endowment for the Humanities, has been a collaboration between historians, geographers, librarians, technology specialists and students. My colleagues and I at MAGIC have had the opportunity to produce innovative digital maps for this project, some of which have been highlighted in our recent, and ongoing, blog series highlighting our partnership with Jack. In case you missed them, follow these links and stay tuned for more!