Media Advisory — March 24, 2011 Census Bureau to Hold Webinar Prior to Release of Center of Population and First Two 2010 Census Briefs

The U.S. Census Bureau will hold a media webinar prior to the March 24 release of the final states redistricting data, national mean center of population and release of 2010 Census Briefs on population distribution and race and ethnicity. Reporters will learn the background on race and Hispanic origin concepts and the types of race and ethnic data that will be reported in the upcoming 2010 Census releases. The webinar will consist of a simultaneous audio conference and online presentation. Reporters will be able to ask questions during the audio conference once the presentation is complete.

When:
Tuesday, March 22, 2011, 2 p.m. (EDT)

Who:
Karen Humes, assistant division chief, Special Population Statistics, Population Division
Nicholas A. Jones, chief, Racial Statistics Branch, Population Division
Roberto R. Ramirez, chief, Ethnicity and Ancestry Branch, Population Division

Details:
Audio conference — access information

Toll free number: 888-324-7210
Participant passcode: CENSUS
Questions and answers are limited to media

Online presentation — access information
Please login early, as some setup is required:

URL: https://www.mymeetings.com/nc/join/
Conference number: PW6204276
Audience passcode: CENSUS

Follow us on Twitter, Facebook, Flickr and YouTube (/uscensusbureau).

Media Advisory — Census Bureau Director to Discuss Redistricting Data, Center of Population and 2010 Census Briefs

U.S. Census Bureau Director Robert M. Groves will brief the media on 2010 Census news, releases and products. Groves will discuss quality indicators and the completion of all releases of 2010 Census redistricting data, and he will announce the site of the new national mean center of population. The briefing will include the release of the first two 2010 Census briefs — population distribution, and race and ethnicity — and a question-and-answer session.

When:
Thursday, March 24, 2011, 2 to 3 p.m. (EDT)

Who:
Robert M. Groves, director, U.S. Census Bureau
Nicholas A. Jones, chief, Racial Statistics Branch, Population Division
Marc J. Perry, chief, Population Distribution Branch, Population Division

Where:
National Press Club, 13th floor
Murrow Room
529 14th Street, NW
Washington, DC 20045

Members of the media may also participate by telephone.
(Please dial-in early to allow time for the operator to place you in the call.)

Dial-in number: 888-390-1046
Password: CENSUS
(For security reasons, the passcode will be required to join the call.)

Online Press Kit:
Event materials will be posted online shortly after the event begins and can be accessed by clicking on the 2010 Census Operational Press briefing at http://2010.census.gov/news/press-kits/operational-press-briefing.

Webcast:
There will be a live webcast of the briefing, accessible at http://www.visualwebcaster.com/event.asp?id=77517 at 2 p.m. (EDT) on event day.

Please RSVP by 5 p.m., Wednesday, March 23, to the Public Information Office at 301-763-3030 or to pio@census.gov.

For more information about the U.S. Census Bureau, please visit and follow us on Twitter, Facebook, Flickr and YouTube (/uscensusbureau).
2010 Connecticut Census Data – Quick Facts

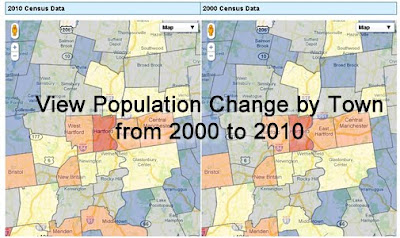
On Wednesday March 9, 2011 at 2:00pm the U.S. Census Bureau released the Connecticut redistricting data. This dataset includes total population, race, ethnicity, voting age (18+), and housing occupancy data for multiple geographies in Connecticut. To allow for quick comparisons between 2000 and 2010, the Connecticut State Data Center has created a dual map viewer which enables users to search for a town, click on the town, and view data from 2000 and 2010 side by side. Check out this Connecticut census data viewer!
Included below is a summary of quick facts from this 2010 Census data release for towns in Connecticut based on population increases and decreases from 2000 to 2010:

Connecticut Towns with Largest Increases in Population from 2000 to 2010

Town 2010 Population
1 New Haven, CT 6,153
2 Danbury, CT 6,045
3 Mansfield, CT 5,823
4 Stamford, CT 5,560
5 Bridgeport, CT 4,700
6 Middletown, CT 4,481
7 Norwich, CT 4,376
8 Hamden, CT 4,047
9 Manchester, CT 3,501
10 Southington, CT 3,341


Connecticut Towns with Population Decreases from 2000 to 2010

Town 2010 Population
1 Branford, CT 28,026 (-657)
2 Enfield, CT 44,654 (-558)
3 East Hampton, CT 12,959 (-393)
4 West Hartford, CT 63,268 (-321)
5 Sherman, CT 3,581 (-246)
6 Salisbury, CT 3,741 (-236)
7 Sharon, CT 2,782 (-186)
8 Old Saybrook, CT 10,242 (-125)
9 Bridgewater, CT 1,727 (-97)
10 New Fairfield, CT 13,881 (-72)

More details will be made available soon! Be sure to check out the newly redesigned Connecticut State Data Center website for 2010 Census data and shapefiles.

Connecticut Town Population 2010 & 2000 Interactive Map Now Available

The Connecticut State Data Center has just released an interactive map to allow users to view 2000 and 2010 Census data for Connecticut towns. This map viewer allows users to search for a Connecticut Town, click on the town to view population, race/ethnicity, voting age, and housing data for 2010 on the map on the left and the user can view 2000 Census data for the town in the map on the right.

The 2010 data was released on 3/9/2011 at 2:00pm and we are still enhancing this mapping interface and we welcome your feedback! Check out this interactive map by visiting the Connecticut State Data Center’s website and click on the Maps link or click the image below
Users can also download this data in spreadsheet (Microsoft Excel format) and in shapefile formats directly from the Connecticut State Data Center’s data page.

Census Bureau Ships Local 2010 Census Data to Connecticut

Today (Tuesday March 8, 2011), the Census Bureau shipped local 2010 Census data to the governor and leadership of the state legislature in Connecticut. After confirmation of receipt, usually within 24 hours of shipment, the Census Bureau will issue a news release with five custom tables of data for the state. Wednesday’s release is expected around 2 p.m. EST. At that time, the full set of data will be available via FTP download at http://www2.census.gov/census_2010/01-Redistricting_File–PL_94-171/. Within 24 hours after release, the data will be posted on the Census Bureau’s new American FactFinder site http://factfinder2.census.gov.

The data will include summaries of:

  • Population totals
  • Race
  • Hispanic origin
  • Voting age

Data will be available for multiple geographies within the state, such as census blocks, tracts, voting districts, cities, counties and school districts.

2009 Annual Capital Expenditures Survey – US Census Bureau

From the US Census Bureau Newsroom:

2009 Annual Capital Expenditures Survey

These data, based on the 2007 North American Industry Classification System, estimate business spending in 2009 for new and used structures and equipment at the sector level, as well as for three-digit and selected four-digit industries. These data are an important input for federal agencies constructing composite national economic measures, such as the Bureau of Economic Analysis’ estimates of private-fixed investment, a major component of gross domestic product; the Bureau of Labor Statistics’ estimates of capital stocks for productivity analysis; and the Federal Reserve Board’s Flow of Funds accounts. The data also provide the business community with a relevant, timely and accurate measure of current business conditions. (Scheduled for release Feb. 10.) Internet address: 

Newsroom: Poverty: Census Bureau Releases Research on the Supplemental Poverty Measure

Newsroom: Poverty: Census Bureau Releases Research on the Supplemental Poverty Measure

The Census Bureau is releasing the research paper, Who is Poor? A New Look With the Supplemental Poverty Measure, plus a number of other technical working papers on the topic. The research paper applies methodology recommended by a federal interagency technical working group to present supplemental poverty estimates. The supplemental poverty measure is based on a more comprehensive definition of poverty and provides an additional look at the impact of federal policies on those in or near poverty. These estimates do not represent the actual supplemental poverty measure because they use 2009 income data combined with 2008 poverty thresholds. Also, these estimates do not replace the official poverty measure released by the Census Bureau in September 2010. Internet address: http://www.census.gov/hhes/povmeas/methodology/supplemental/research.html

First 2010 Census Results – Population by State

The first population data from the 2010 Census data has been released which provides population by state data. This data is critical to the apportionment process, where the 435 seats within the United State House of Representatives are divided among the 50 states to provide equal representation, based on population. Based upon the 2010 Census Population data, the following map generated by the US Census Bureau provides a national picture of the number of congressional seats gained, lost, or unchanged for each state.

Connecticut Data
Based upon the 2010 Census data released on December 21, 2010, Connecticut’s population as of April 1, 2010 was 3,574,097 an increase of 4.9% from April 1, 2000 (3,405,565). Utilizing this data, the number of representatives for Connecticut in the House of Representatives will remain steady at 5 representatives.
National Data Highlights
While the number of representatives from Connecticut will remain steady, other states will experience gains/losses in the number of representatives provided by their state in the House of Representatives. Included below is a quick listing of states that gained and lost seats:

State Seats State Seats
Arizona +1 Illinois -1
Florida +2 Iowa -1
Georgia +1 Louisiana -1
Nevada +1 Massachusetts -1
South Carolina +1 Michigan -1
Texas +4 Missouri -1
Utah +1 New Jersey -1
Washington +1 New York -2
Ohio -2
Pennsylvania -1
To view each dataset released on December 21, 2010 by the United States Census Bureau click the following links:

Table 1. Apportionment Population and Number of Representatives, by State: 2010 Census [ Excel | PDF ]
Table 2. Resident Population of the 50 States, the District of Columbia, and Puerto Rico: 2010 Census [ Excel| PDF ]
Table 3. Overseas Population of the 50 States and the District of Columbia: 2010 Census [ Excel | PDF ]
Table 4: Resident Population of the 50 States, the District of Columbia, and Puerto Rico: 2010 Census and Census 2000 [ Excel | PDF ]
Table 5: Resident Population of the 50 States, the District of Columbia, and Puerto Rico: 2010 Census and Census 2000 [ Excel | PDF ]
What is Apportionment?
To learn more about the apportionment process, view the following video produced by the U.S. Census bureau:


Want to learn more about how the population has changed by state over time? The following interactive map includes population change, population density, and apportionment data from 1910 to 2010 by state. This interactive map provides a streamlined visualization of changes in population distribution throughout the United States over time.