Opportunities #4: ESRI Mashup Challenge

Are you interested in creating mashups? If so then this opportunity may be of interest to you. ESRI has recently announced a Mash-up competition with the first place prize of $10,000!

The guidelines for this competition are relatively simple: construct a mashup using ESRI’s ArcGIS Online content and Web APIs, Publish the related URL, and create a YouTube video describing your application. The deadline for this competition is March 5, 2010.

For additional details visit: http://www.esri.com/software/mapping_for_everyone/api/mashup.html

Opportunities #2: CaGIS Scholarships

Applications for the 2010 Cartography and Geographic Information Society (CaGIS) scholarships are being accepted until January 15, 2010. Candidates must be enrolled full-time in a four-year undergraduate or graduate degree program during 2009 or 2010, studying cartography, geographic information science, or a closely related field. Awards range from $500 for masters degree seeking students to $1,000 for PhD degree seeking students.


For additional details visit: http://www.cartogis.org/awards/cagis-scholarships/scholarship

Opportunities #1: Newberry Library Fellowships

This is the first posting of a new series we are adding to Outside the Neatline to share opportunities for grants, fellowships, presentations, and publishing. The Newberry Library in Chicago, Illinois [map it] has a short term and a long term fellowship opportunity for to conduct research using their vast collections.

For short term fellowships, PhD and post-doctoral scholars are eligible and awards are typically for one month periods. Stipends are $1600 per month.

For long term fellowships, are designed to support research and writing by scholars with a doctorate for a range of 6-11 months. Stipends are up to $50,400.

Full details on the Newberry Library Fellowships are available at the following link.

Map of the Week #7 – Montana 1911

State of Montana – Department of the Interior General Land Office Map – 1911

While searching for maps of Yellowstone National Park, this gorgeous map of Montana was discovered while exploring the map collection at MAGIC. This 1911 map includes Indian Reserves, National Parks, Reclamation Projects and U.S. Land Offices as well as several other features.

This map includes railroad lines and it is clearly visible that the Northern Pacific Railroad has a spur line which provides passengers with access to Yellowstone National Park. The desire to connect Yellowstone via rail is clearly evident in the History of Northern Pacific Railroad by Eugene V. Smalley in1883 which is included below.

Explore this map in the original size view (this may take a few moments to load) and share the amazing features relevant to your research with us by posting a comment.

Map of the Week #6 – Columbus, Ohio

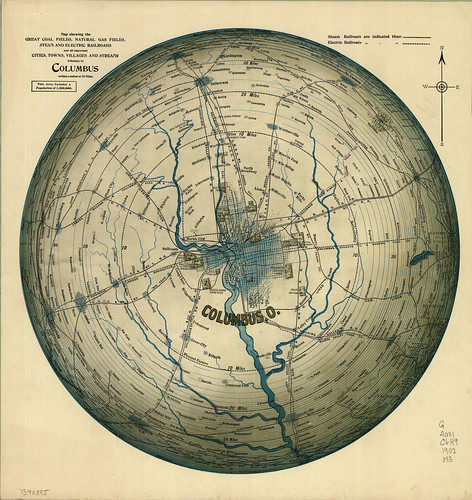
Map Showing the Great Coal Fields, Natural Gas Fields, Steam and Electric Railroads: and All Important Towns, Villages, and Streams Tributary to Columbus Within a Radius of 70 miles

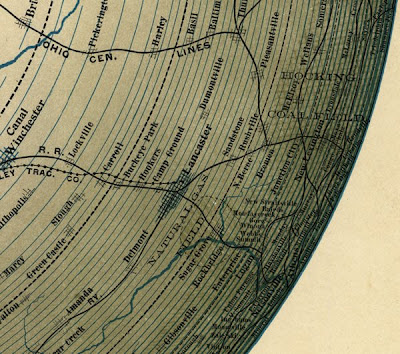
The above map depicts the city of Columbus, Ohio in 1902 in an azimuthal projection with the center focused on the city of Columbus. This unique perspective includes a limited view of the region with a 70 mile range and highlights numerous gas and coal fields along with railroads connecting the region.

A notable location on the map includes the Hocking Coal Fields (southeast of Columbus) which includes New Straitsville, Ohio. This was the site of the 1884 coal miners strike where striking coal miners planned for their strike in Robinson’s Cave, and pushed burning coal cars into a coal mine owned by the New Straitsville Mining Company, setting the mine ablaze.

While not completed until 1903, the Columbus, Delaware, and Marion interurban electric railway is clearly depicted on this map.

There are several other interesting locations on this map. Feel free to share you favorites by including them in the comments for this blog post.

Map of the Week! #5 Sleeping Sickness in Africa 1909

Okay, so maybe there’s two maps this week, but they’re closely related!


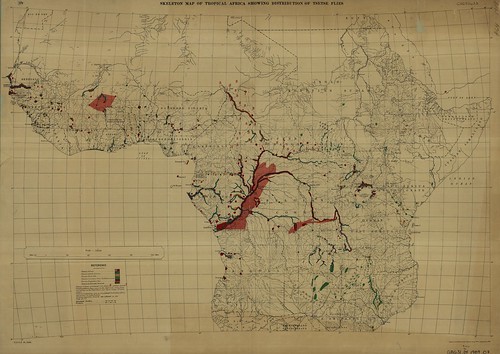
Map 1.) Skeletal Map of Tropical Africa Showing Distribution of Tsetse Flies


Map 2.) Skeletal Map of Tropical Africa Showing Distribution of Sleeping Sickness and Glossina Palpalis

Both of these maps were published in 1909 by the Ordnance Survey of Great Britain. Map 1 shows the spatial distribution of Tsetse flies which were discovered to be the vector for the disease sleeping sickness (African Trypanosomiasis).

Tsete flies (Genus Glossina) have several species that exist on the African continent. On Map 1 you can see that there are several species of Glossina listed. These species have slightly different habitats as shown below (click the links for modern day maps, how do they compare to the 1909 maps?):

There are many other species of tsetse flies, for a brief list, click here.

The actual parasite that the tsetse flies act as vectors for is the protozoa Trypanosoma brucei , more specifically African Trypanosomiasis.


Trypansomiasis can be a fatal disease that first causes the lymphnodes to swell, insomnia at night and fatigue by day (hence “sleeping sickness”). For a list of symptoms and stages of the illness click here. It was not until 1902-1903 that it was discovered by Sir David Bruce that the tsetse flies were the vector for this parasitic disease. This cognitive leap must have prompted the mapping of tsetse fly habitats and distribution to predict the occurrence of sleeping sickness and take initial steps in mitigating the disease. Turn of the century GIS!
Oh yeah, if you want some GIS data on tsetse fly distribution, check out this page sponsored by the FAO.

“Hooray for geography and hooray for maps!” I say!

Did You Know? #6 Raster Vs. Vector

Geographic Information Systems (GIS) primarily use two categories of digital data: 1) Raster Data and 2) Vector Data.
Raster Data:
Raster Data portrays real world data as a matrix or a grid of cells (see Figure #1). Raster data is very good at storing continuous data (for example: precipitation, temperature, and elevation). Each cell stores information numerically, usually between 0-255 and has a geographical location. A weakness of raster data is that the cells are squares and most real world information doesn’t fit into a perfect square(See Figure#2). So sometimes a map made with satellite imagery will either underestimate or overestimate a land cover type.

Vector Data:
Vector Data portrays real world data as a point, line or polygon. Vector data is very good at storing discrete data (for example: political boundaries, rivers, lakes, land parcels, and streets). Each point, line, or polygon is called a feature and has a unique ID# (see Figure #2). Attribute information can be added to each feature in geographical space. A weakness of vector data is that it sometimes needs great amounts of processing power to run a complex analysis.
Below are links to examples of raster (Source: ESRI) and vector data (Source: CT DEP, MAGIC)
Click to view an example of vector data (point features):
Click to view an example of vector data (polygon features):
Click to view an example of vector data (Line features):

How in the World #2

How in the world can the average person access GIS data just as easily as mapping professionals?

In the last “Did You Know?” We introduced GIS (Geographic Information Systems), how it works and what it is used for. Today we would like to show you how to retrieve and view GIS data. You might ask yourself how you can do this without specialized GIS software. No worries, we’ll show you how. All you need is your internet browser!

First, navigate a separate internet browser window to http://magic.lib.uconn.edu/ , once there click on GIS Data located on the top navigation bar

On the next page you will see several icons shaped like the state of Connecticut with categories listed beneath. Today we’re not interested in roads or political boundaries, Brandon and Jeff are going fishing! Jeff knows there are lots of boat launches on the coast but he can’t remember if there is one near Point Bluff State Park. To find out if there is a boat launch click on the Places data category on the right hand side:

This will take you to the places data on the GIS Data page where you’ll find a GIS data layer for Boat Launches! Listed information includes the date, the source (in this case the Connecticut Department of Environmental Protection), and data formats. Today lets preview this data in Google Maps, so on the right hand side of the screen click on the map preview icon:

Your internet browser will now display all of Connecticut’s boat launches in Google Maps:

Let’s check out if Bluff Pont State Park has a boat launch, look at the listing of boat launches on the left, Click on Bluff Point Boat Launch. A balloon will appear on the map giving the location of the boat launch. So we’re done right? We now know that there is a boat launch at Point Bluff State Park. But what if we need bait or fishing tackle while we’re out fishing? Let’s use Google Maps to find out.

On the Bluff Point Boat Launch Balloon, click search nearby. In the text box type Tackle Shop then click the search button.

Google Maps will now display all the tackle shops in the vicinity of the Bluff Point Boat Launch. By clicking on any of the markers a balloon will display the tackle shops name, address, and phone number. You’ll also have the option to get driving directions!

Congratulations, you are now an experienced GIS user! In this exercise you have loaded, queried, and analyzed a GIS data layer! Now you can experiment with MAGIC’s other data layers and have fun making maps. Now you can love geography as much as Brandon and Jeff do!

Introducing Outside the Neatline!

About Outside the Neatline:

Outside the Neatline is a collaborative effort of graduate students who work at The University of Connecticut Libraries’ Map and Geographic Information Center (MAGIC). Our aim is to give the public a better understanding of what we actually do all day besides high-fiving each other when we find a neat new map. What we actually hope to illuminate is the usefulness of historic maps, digitally storing and displaying paper maps, and how they may be used in current mapping technologies.

Things to look forward to from Outside the Neatline include:

  • Featured Map of the Week – The staff’s favorite picks.
  • How in the World? – How the graduate students turn paper maps into digital wonders.
  • Did You Know? – General geography facts, definitions, and other tasty tidbits.
  • And More! – We’re open to suggestions, what do you want to see?
The main objective of Outside the Neatline is to provide our audience geographical knowledge in a fun and lighthearted way. So we hope you enjoy your visits to our site and please feel free to make this an interactive experience!

About the Authors:


Jeff Dunn earned his M.A. in Geography at West Virginia University and is currently a PhD student of Geography at the University of Connecticut. During semester breaks he works at MAGIC as a GIS Analyst scanning maps, georeferencing, and developing geography curriculum. Jeff’s specific areas of interests are in remote sensing and coastal geography. Outside of academics, Jeff is an avid fly fisher.


Brandon Cramer is a PhD student in Geography at the University of Connecticut. He received his M.A. in Geography from the University of Connecticut in 2008. Brandon is mainly interested in using geography to examine environmental and health issues. He has worked with government agencies to reduce agricultural pollution and analyze geographic disparities in disease and illness. Over winter and summer breaks Brandon is a GIS Analyst at MAGIC and works on scanning and georeferencing current maps and creating custom maps to fit users’ needs by special request.