Spring 2011 Workshops

The Map and Geographic Information Center and the Connecticut State Data Center have teamed up with various partners to offer a series of workshops for the Spring Semester. Included below is a listing of workshops available that are free for faculty, staff, students, and the public to attend. Be sure to register quickly as these workshops fill up fast.

GIS for Social Sciences: Introduction

Are you interested in learning how to harness the power of GIS software to create maps using social science data? This workshop will provide participants with an overview of using ESRI’s ArcGIS software, locating boundary files, joining datasets, and creating a map based on social science data.

This workshop is sponsored by the Center for Population Research.

Friday 02/11/11 from 10:00 AM to 12:00 PM [Register for this workshop]

OR

Friday 02/11/11 from 2:00 PM to 4:00 PM [Register for this workshop]

GIS for Social Sciences: Advanced

Are you interested in converting your social sciences data from data to a dynamic display of charts and maps? This workshop provides participants a hands-on experience with mapping social sciences data, reprojecting data, exploring spatial data analysis tools, and creating a map for use in a presentation, publication, or in class.

This workshop is sponsored by the Center for Population Research.

Friday 02/25/11 from 10:00 AM to 12:00 PM [Register for this workshop]

OR

Friday 02/25/11 from 2:00 PM to 4:00 PM [Register for this workshop]

The Status of Hispanic Americans in the first decade of the 21st Century

With the conclusion of the decennial US Census, new data about the Hispanic American population in the United States will be released in the coming months. This workshop aims to teach attendees how to access and utilize the wealth of information available from the US Census website. Participants will also explore the American Community Survey (an annual survey that tracks such variables such as Education, Employment, Language, Origins, Race and Ethnicity, etc.). The workshop will also highlight the differences between the decennial and the American Community Survey, explore statistical data and mapping tools for using Census data to help us determine the status of Hispanic Americans in the first decade of this new century. Space is limited so sign up now!

This workshop is sponsored by the Institute of Puerto Rican and Latinos Studies (PRLS), and ALFAS (Association of Latino/a Faculty and Staff), and the UConn Libraries.

Friday 04/01/11 from 10:30 AM to 11:30 AM [Register for this workshop]

OR

Friday 04/13/11 from 1:30 PM to 2:30 PM [Register for this workshop]

MAGIC GeoCommons Enhancements!

We are delighted to announce that the University of Connecticut Libraries Map and Geographic Information Center – MAGIC GeoCommons space has been upgraded thanks to support from the University of Connecticut Libraries Planning Team. The MAGIC GeoCommons space is a publicly accessible space designed to enable students to collaborate on location based research. This upgraded space includes 2 collaborative tables where small groups can collaborate using their laptops (or using the desktop computer available at one of these tables) and display their work on a 46″ screen. To further promote collaboration, 5 smaller tables on wheels are available in the space and can be reconfigured to allow for small to large groups that need to collaborate with using print materials (e.g. atlases, books, and maps) and laptops.

Now that finals are approaching, be sure to stop by and visit the new MAGIC GeoCommons space if you are on campus!

Want to preview the space virtually? Included below are photos of the MAGIC GeoCommons space before and after the enhancements were added to the space:

Before
GeoCommons featured 3 large tables, 15 chairs, and a large screen for collaborative use

After
GeoCommons now features 5 tables on wheels, 2 collaborative tables, 2 – 46″ screens with laptop connectivity, and 30 new chairs on wheels!

University of Connecticut Geography Club

A new and forming group of students in the Department of Geography at the University of Connecticut is forming a geography club for undergraduate students.  The club typically meets on Wednesday evenings at 7:00 PM in CLAS room number 420.  The next meeting dates are:

Wednesday November 17, 2010 at 7 PM
Wednesday December 1, 2010 at 7 PM

Free pizza will be provided to all who attend on December 1st.  Preliminary activities that the club is considering engaging in are:

Your involvement in the club will present opportunities for leadership development, social networking, and opportunities for degree related experience.  Come check out the geography club at UConn!

LibQUAL+ Survey – Help the Libraries Help You And You May Win $500!

Attention all UConn Students, Faculty and Staff!

The University of Connecticut Libraries needs your help and participation in the Fall 2010 LibQUAL+TM Survey.

The LibQual+TM Survey has been used by more than 1,200 libraries internationally to periodically and consistently track, understand, and act upon their users’ opinions of library service quality.

As in the past, the LibQual+TM Survey results will inform our Libraries’ planning on how to best provide library services to the UConn community. This survey process has been reviewed by UConn’s Institutional Review Board (IRB) and all responses are confidential and will not be associated with a respondent’s e-mail address or other personal information.

One participating student* (grad or undergrad) will win a $500 GIFT CARD from the UConn Co-op!

The link to the survey can be found in your e-mail. If you missed the e-mail, have questions, or need assistance in any way, please contact librarysurveys@uconn.edu

Please complete the survey by: December 10, 2010

Thanks for participating!

* Participation in the drawing is optional. Eligible students must be registered to take classes at the University of Connecticut during the Fall, 2010 semester; have completed no more than one online survey; have entered an optional “uconn.edu” e-mail address at the time the online survey form is completed; not be an employee of the State of Connecticut, including student employees of the University, or of the UConn Co-op; permit the University of Connecticut to make public a photograph, name, home town, academic year and major of the winning entrant; agree to any rules and restrictions placed upon the use of the gift certificate by the UConn Co-op.

Did You Know? #30 International Conference on Crisis Mapping 2010

The International Conference on Crisis Mapping will be held in Boston, MA October 1-3, 2010. The goal of this conference is to bring together engaged practitioners, scholars, software developers, and policymakers at the cutting edge of crisis mapping with focus on crisis mapping applications in the disaster response to Haiti and beyond. If you are interested in learning more about crisis mapping applications, be sure to check out the ICCM 2010 Conference Website for more details.

Did You Know? #29 Location Sharing Technologies and Your Privacy

With a wide range of location sharing enabled applications for mobile devices (e.g. Gowalla, Foursquare) users may be wondering how privacy is impacted by all of these location enabled applications. On July 27, 2010 EDUCAUSE hosted a webinar titled “Location-Sharing Technologies – Privacy Risks and Controls” with Lorrie Faith Cranor from Carnegie Mellon University which discussed several issues related to privacy with location based information. This webinar broadcast was recorded and can be viewed in its entirety at the EDUCAUSE Live! Archive.

What are your concerns with privacy and location sharing enabled applications? Let us know by commenting on this blog.

Map of the Week #8


This “Map of the Week” post was inspired by some maps that were given as a gift. Yes, the best maps are the ones freely given! These maps came to me by a friend at the WV GIS Technical Center a couple years ago.

The best thing about these maps is that they came with a book! The book’s title is “Annual Report of the State Geologist for the Year 1907” The reports included within are:
The maps within outline the report on the Inland Waterway that may have more than a strong connection to the Intracoastal Waterway that was authorized in 1919 by the United States Congress. Below are the maps included with the text that can’t be found at Google Books or The N.J. DEP. As always the maps are available to download from MAGIC’s Flikr account! Click on the sheet title above each map for the corresponding Flikr page.
Additionally, you can view and download the report from the New Jersey Departement of Environmental Protection here. At the previous link you will have access to the Annual Report of the State Geologist for many different years.
If you want to examine current Intracoastal Waterway navigation maps, check out NOAA’s Office of Coast Survey Online Chart Viewer. This link will bring you to a portion of the New Jersey Intracoastal Waterway, while this link will bring you to an index of all the available charts for the Intracoastal Waterway for online viewing.
All this talk get’s me in the mood to go sailing! Maybe I should sign up for some lessons first?

Did You Know? #26

You can view Aerial Photos directly from our photo indices!
Use MAGIC‘s Google Map indices mash-up to search for aerial photos anywhere in Connecticut.

Your browser does not support iframes.

Years of aerial photos that are available for direct preview are:

Other photo indices are available to preview in Google maps and will soon be enabled for direct photo preview. Also, as an alternative, download Google Earth and preview the indices in conjunction with other KML files from MAGIC’s GIS Data offerings.

Opportunities #5: AGS Library Fellowship

The American Geographical Society (AGS) Library at the University of Wisconsin-Milwaukee Libraries is accepting applications for two short-term fellowship programs.

McColl Research Program Fellowships

This is a short-term fellowship program available to individuals who wish to communicate their geographical research results to a broad, educated general audience.
Awards of $3,300 for four-week fellowships will be provided to support residencies for the purpose of conducting research that makes direct use of the Library, and results in publication in a mutually agreed outlet.

Helen and John S. Best Research Fellowships

Stipends of $400 per week, for periods up to 4 weeks, will be awarded to help support
residencies for the purpose of conducting research that makes direct use of the Library.

Fellowship information is available at the AGS Library website at:
http://www.uwm.edu/Libraries/AGSL/fellowships.html

For more information on the AGS Library is available at the website:
http://www4.uwm.edu/libraries/AGSL/index.cfm

Applications must be received by October 18, 2010. All fellowships are
tenable in 2011.

This opportunity was brought to our attention from the Maps-L listserv.

MAGIC 2.0: Using GIS to Empower K-12 Curriculum Development.

ABSTRACT


Continued integration of spatial data sets into emerging web mapping platforms has increased the opportunities for non-expert users of GIS to perform spatial analysis. These web mapping platforms have become user-friendly and can enable the development of GIS resources and maps for learning opportunities in the K-12 environment. This poster will illustrate how the University of Connecticut’s Libraries Map and Geographic Information Center – MAGIC has developed simple learning experiences using GIS data and Google Maps which can be integrated within the K-12 curriculum. Through the blog “Outside the Neatline” MAGIC hopes to display a vast array of sample lesson plans/activities which integrate Web GIS and Maps, and is developing resources which encourage educators to integrate spatial thinking skills in an interdisciplinary fashion.


Outside the Neatline is a blog that began as a collaborative effort of graduate students who work at MAGIC with an aim to give the public a better understanding of what geographers do and how to use web mapping platforms. The blog grew and potential learning applications in the classroom using this site became evident. What we hope to illuminate now is the usefulness of historic maps, digitally storing and displaying paper maps, and how they may be used in current web mapping platforms. Our delivery mechanism just happens to be Outside the Neatline, which is composed of the following features:


Did You Know?

The “Did you know” segment of Outside the Neatline features how GIS professionals use geography everyday by professionals in the industry. Additionally, this category reports on news items, opportunities, and innovations in the field of Geography. These items are worth reporting on as it demonstrates that geographical concepts have concrete applications in the world outside of the classroom.


How in the World?

Demonstrates how geographic information from everyday sources (paper maps, GPS, literature) can be transformed into digital geographic information for use in a Geographic Information System. The importance of this category shows students that current digital geographic information comes from existing primary and secondary print resources.
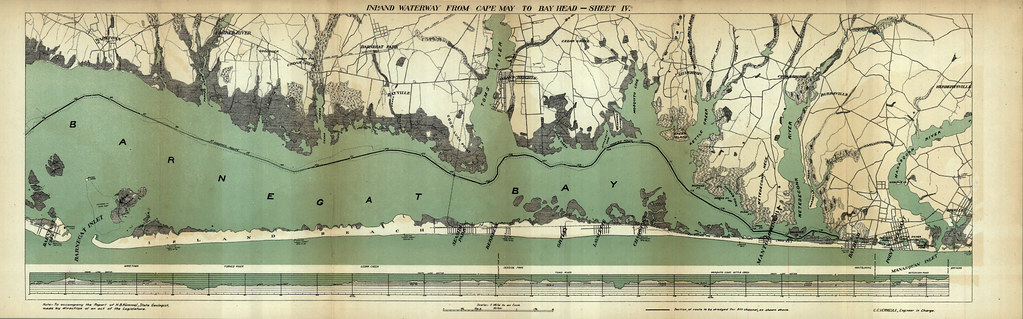
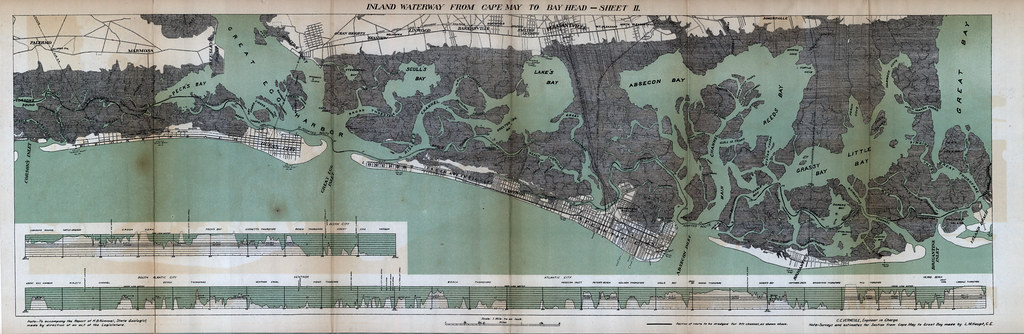
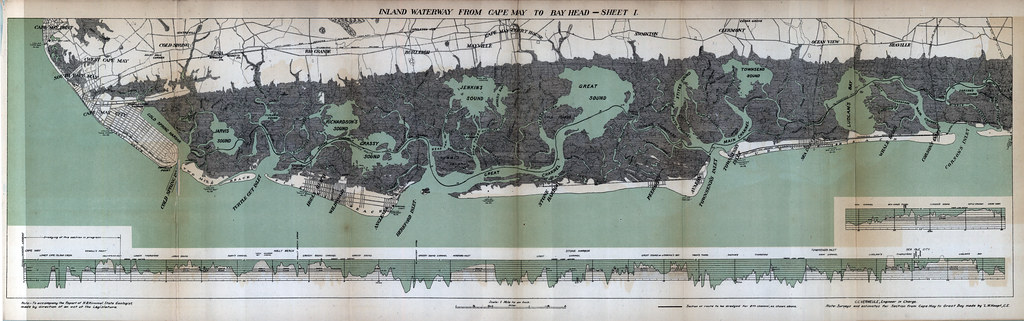


Map of the Week

Map of the Week draws its strength from bundling together many different content areas with a map as the common element. The featured map captures many different elements:


History

Maps are inherently temporal, freezing a moment in time. Often the maps content are directed by the context of when and where they were created. Outside the Neatline takes advantage of this information and provides a brief historical summary, web links to significant events, figures, and places related to the map, and when available photographs to illustrate the importance of that map.


Reading and Writing

The “Map of the Week” web feature is created in such a manner that there is much more then images to peer at. As described in the history portion a brief written history is included with web links to other informational websites. When available, a Google Book will be embedded on the “Map of the Week” page that is directly related to the map. While reading skills can be increased by an exposure to new vocabulary, improving writing skills is not out of the question. The creators of Outside the Neatline envision instructors using the “Map of the Week” posts to act as a springboard for creativity by inspiring writing exercises related to the story that a map can tell. The students imagination is clearly the only limit.


Science and Math

While there is much to be said about the science of map making, the content of the maps is what will spur scientific inquiry. Maps of precipitation, temperature and vegetation types could easily be integrated into climate and weather units. Distribution maps of tsetse flies and incidence of sleeping sickness infections in Africa lend themselves to discussions on human /environment interaction and biology. Even railroad maps can begin a dialog about the steam engine and the Industrial Revolution.


The next two sections are examples of how Web 2.0 GIS technology can be leveraged in the classroom.


Google Maps GIS Exercise


The following is an excerpt from an Outside the NeatlineHow in the World?” blog post. The object of the page is to act as a spring board activity and to show users that the average person can access GIS data just as easily as mapping professionals.


Your browser does not support iframes.

Congratulations, you are now an experienced GIS user! In this exercise you have loaded, queried, and analyzed a GIS data layer! Now you can experiment with MAGIC’s other data layers and have fun making maps.


This activity has engaged the students and sets them up to find and give directions, search for adjacent places, plan how much money Jeff and Brandon will need for fishing equipment, and write about Jeff and Brandon’s fishing adventures!


MAP OF THE WEEK AND MAP MASH – UPS

Map of the Week

The “Map of the Week” blog entry begins with a unique featured paper map from the MAGIC map collection. A brief introduction to the map outlines the origins and historical significance of the map to give it proper context. Individual features are selected from the map and highlighted in the blog entry. Each highlighted feature is linked to other websites that provide a greater depth of information.


The objective is to use the map as an aggregator of digital data . The strength of the “Map of the Week” blog entry is it’s ability to act as what others may term as a webquest or web assignment home page. Unlike the older concepts of webquests, a live blog in the Web 2.0 era allows educators to embed their own content, or content from Google books, or Google maps, or video from related sources on the internet. Additionally, in a Web 2.0 world, students can create their own map of the week!


See Below for a “Map of the Week” blog entry that leads into a Map Mash – Up of Chicago, Illinois.

Your browser does not support iframes.

Map Mash-ups

A Google Map Mash-up is created by georeferencing and placing user created maps content in Google Maps web mapping engine. These are powerful learning tools on their own that can highlight the differences and similarities of a place over time. Additional custom content can be added to these maps in the form of KML layers.


Below is an example of a map mash-up created to supplement a “Map of the Week” blog entry on Chicago during the Worlds Fair in 1893. Places and addresses can be searched on this map using Google Maps geocoding engine and then compared to modern satellite or map layers.


The example below demonstrates the above capabilities in addition to how points of interest can be exported as KML layers that also have HTML pop up balloons that link to outside sources for further information.

Your browser does not support iframes.

FUTURE POSSIBILITIES


The previous examples are only a sample of what is possible in the classroom using Web 2.0 technologies in conjunction with geographic content. While these developments are exciting there are still more innovations on the horizon.


An innovation of interest is development of mobile technologies. Since these have become ever more prevalent the possibilities of Geo-Web 2.0 are only limited by the imagination.

Future releases from MAGIC include smartphone applications that allow access to:

  • Google Map Mash-up Campus Bus Routes
  • Google Map Mash-up Campus Building Maps
  • Academic Calendar
  • Outside the Neatline Blog and “Map of the Week” interdisciplinary posts.

We are most excited about using the smartphone to access Outside the Neatline and MAGIC historical maps via Quick Response (QR) bar codes.


The possible use of QR Codes for creative use in the classroom is an avenue we are looking forward to exploring further. We envision a geography treasure hunt where students find and access web maps and geography blogs using an enabled smartphone. QR codes are easily created and can be used so that individuals could access maps and other spatial information in near real-time.


By the way, the QR code below are active and will lead you to some of our URL’s. Go ahead, give it a try!