Percentage of Populations in the US Living in Poverty

Yesterday, I generated the above map of poverty using TIGER shapefiles and data from the 2010 American Community Survey 1 Year Estimate.  This map demonstrates the unequal geographic distribution of poverty in the United States. Most notably, there is a sharp contrast between the relatively low percentages of the northern states and the higher percentages of southern states, Puerto Rico, and Washington, D.C. According to the data, Mississippi (18.9%) has the highest percentage of its population living below the poverty level while New Hampshire (7.8%) has the lowest.

Here is a shot of the data I acquired from the American Fact Finder:

Although ACS estimates can be useful in identifying patterns, they can also have a large margins of error, so it should be understood that the data is limited in its capabilities.

Media Advisory — Census Bureau to Hold Webinar Prior to Releasing List of Jurisdictions Required to Offer Language Assistance to Voters

What:

The U.S. Census Bureau will hold a webinar to discuss the upcoming release of a list of jurisdictions that must provide language assistance to voters. Under Section 203 of the Voting Rights Act, jurisdictions must provide assistance to specific minority groups who are unable to speak or understand English adequately enough to participate in the electoral process. This is the first time American Community Survey estimates will be used to determine the list of jurisdictions.
The event will consist of an audio conference and online presentation. The webinar will explain background information on Section 203, how the list of jurisdictions is determined and provide information on the upcoming release. It will conclude with a question-and-answer session for reporters. We suggest participants log in and call in early.
When:
Tuesday, Oct. 11, 2011, 1 p.m. (EDT)
Who:
Cathy McCully, chief, Census Redistricting Data Office
Rod Little, associate director, Research and Methodology Directorate
Details:
Audio conference ― access information
Toll free number: 1-888-324-8115
Participant passcode: CENSUS
Note: Stay on the line until operator asks for the passcode. Do not key in passcode.
Online presentation ― access information
Please login early, as some setup is required.

URL: https://www.mymeetings.com/nc/join/
Conference number: PW8555041
Audience passcode: CENSUS

2010 ACS 1 Year Estimates Released – 9/22/2011


The 2010 American Community Survey (ACS) 1 year estimates were released today (9/22/2011). These estimates provide detailed social, economic and housing estimates (e.g. education, langauge, income, poverty, housing value, etc.) for geographic areas with a population of at least 65,000.

The 2010 American Community Survey (ACS) 1 year estimates include data for the state of Connecticut, Connecticut Counties, and Bridgeport, Danbury, Hartford, New Britain, New Haven, Norwalk, Stamford, and Waterbury.
For additional information on the release visit: http://www.census.gov/acs/www/data_documentation/2010_release/

The 2010 ACS 1yr Estimates are accessible through the NEW American Factfinder located here: http://factfinder2.census.gov/

Creating a Simple Hurricane and Population Map in ArcMap

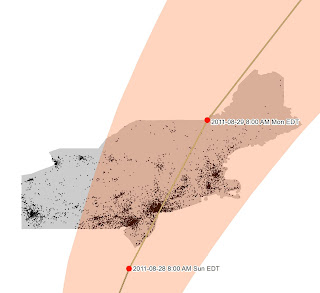
Irene’s projected path through the densely populated Northeast as of Thursday morning. 

Last week, I created a population density map with Hurricane Irene’s projected path overlayed for the CRE Blog. The following is a brief tutorial on how to do something similar…

1. Acquire Data – For this map, I acquired three types of data: Shapefiles from the census delineating politcal boundaries, a spreadsheet containing population data and Hurricane Irene’s projected path. The two former datasets are from the US Census while the latter comes from NOAA.

1A. Acquire Tiger Shapefiles – Tiger Shapefiles, from the US Census, can be acquired here.

1B. Acquire Census Population Data – 2010 Census Population data can be found through the American Fact Finder. To specify the Geographies I want, I must select them in the Select Geographies window. I decided to use County Subdivisions (Towns) for Maine, Massachusetts, New Hampshire, New York, Pennsylvania, Rhode Island, and Vermont.

1C. Acquire Hurricane Irene Data – Hurricane GIS data can be found on the National Hurricane Center website.

2. Join Population Data and Tiger Shapefiles – After acquiring the population shapefiles and data table, it is necessary to join the two. This must be done for all the towns, except for Connecticut. For the towns in CT, I downloaded (pre-joined) shapefiles from MAGIC’s GIS data page.

In order to join the non-CT shapefiles and data tables, I must use the Join dialog box (Right-click on the layer in your table of contents, “Joins and Relates”, “Join..”). In this box, select the common field for both your shapefile, and data table; for this exercise it is the “GEOid” field. It may be necessary to open the attribute table of your shapefile and data table independently to determine the common field. Because my data is in individual shapefiles by state, I must repeat this step for each of the states.

3. Symbolize Layers – Once the population data and shapefiles are joined, they are ready to be symbolized. I chose to create a dot density map based on total population. This is done under the Layer Properties.

Dot Density is found under Quantities on the left side of the dialog box; more than one field can be symbolized at once as long as it is a part of the attribute table of the respective shapefile you are working with. Again, because my data is in individual shapefiles by state, I must repeat this step for each of the states.

This is the point at which I symbolized my point, line and polygon hurricane layers, respectively. These were more straightforward: I used a single symbol (under Features) in the Symbology tab of the Layer’s Properties.

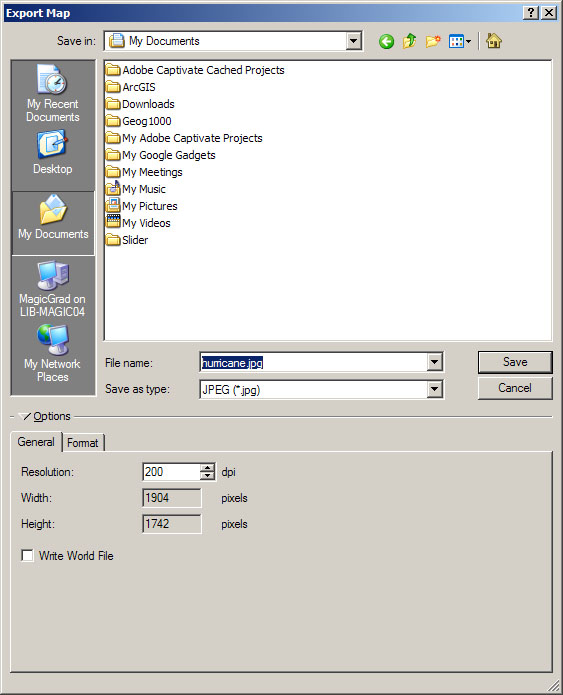
4. Export as .JPEG – Lastly, since my map was intended for web display, I chose to export it as a .JPEG (although you could also choose other common image files such as .PDF or .PNG). This can be done in the Export… dialog box which is accessed through the File tab of ArcMap.

Racial Change in the Hartford Region, 1900 – 2010: An Animated Time-Slider Map

This is the third in a series of posts on web-based maps developed by the University of Connecticut Libraries Map and Geographic Information Center (MAGIC) for the On The Line project.
Digital maps enable the ability to display dynamic changes to social phenomena in places throughout time. Hartford, throughout the 20th Century, saw dramatic shifts in the racial composition in both the city and county as a whole. Early in the century, the region’s population was predominantly white. During the middle of the century, the region began to diversify. This transformation began in the urban core and moved its way to the suburbs. This is portrayed in On The Line’s Racial Change in the Hartford Region (1900-2010) Animated Time-Slider Map. You can see this progression by simply dragging the time-slider to different years!
Here at MAGIC, we created a series of cartographic layers of Hartford County showing racial distribution based on the decennial census. These layers, from 1900 to 2010, demonstrate two things. The first is the increase of the non-white population in Hartford County throughout the 20th century. The second item, which is less noticeable, is the increasing detail in which the Census Bureau gathered racial data throughout the century. Early in the century, race was distinguished by “White” versus “Non-White” or “Negro”. By 1980, the Census was (and still is) gathering more detailed racial data – by including additional race and ethnicities such as Hispanics and Asians. This map also includes “pop up” labels that include percentages by race and ethnicity and total population figures. These labels can be viewed by clicking on any location on the map.
With support from the National Endowment for the Humanities, MAGIC created this and other interactive maps with Jack Dougherty of Trinity College for the On The Line project. This and other maps are freely accessible in a public history web-book, titled On The Line: How Schooling, Housing, and Civil Rights Shaped Hartford and its Suburbs, which tells the story of schooling and housing boundary lines that have divided metropolitan Hartford, Connecticut over the past century, as well as the struggles of ordinary families and civil rights activists who have sought to cross over, redraw, or erase these lines.
Technical Detail:
The cartographic layers for the Racial Change in the Hartford Region animated time-slider map were created using ESRI’s ArcMap software, then exported as KMZ files using the ArcToolbox conversion tool. To improve the formatting of the individual pop-up balloons, each balloon added custom HTML code to improve the overall display of the data, and then this layer was saved as a KMZ file.
The interactive map utilizes the Google Maps API v3 plus custom javascript code developed by Thomas Bachant and Jean-Pierre Haeberly to create the interface that incorporates each KMZ file by year with a time slider. Each time the time slider is moved, the corresponding KMZ file for that year is added to the map to allow users to visualize the data.
Special Thanks to Thomas Bachant and Jean-Pierre Haeberly for developing the custom javascript code for this map.

2012 Census of Governments is Fast Approaching!

The Census of Governments  begins in October of 2011 with the mailing of the Government Units Survey.  This survey collects descriptive information on the basic characteristics of local governments in preparation for the 2012 Census of Governments.  Data from this survey will also be used to produce the official count of local government units in the United States and to update and verify the mailing addresses of government units.  In 2012, the Census Bureau will request data on the employment and finances of state and local governments.

Under Title 13, Section 161, the Census of Governments has been conducted for years ending in “2” and “7” since 1957.  The Census of Governments provides the only source of comprehensive, uniform statistics on the economic activity of state and local governments, as it identifies the scope and nature of the Nation’s state and local government sector; provides authoritative benchmark figures of public finance and public employment; classifies local government organizations, powers, and activities; and measures federal, state, and local fiscal relationships.  Following the activity of governments over time tells the story of the fiscal condition of federal, state, and local government thus helping policy makers make informed decisions. 

Data from the Census of Governments are used by the Bureau of Economic Analysis as input to the Gross Domestic Product (GDP) and the Federal Reserve Board as input to the Flow of Funds account.  State and local governments use the data to develop programs and budgets, assess financial conditions, and perform comparative analysis.

The first data from the Census of Governments is scheduled for release beginning in August 2012 providing the number and types of government units by state.  More comprehensive data will follow.    If you have questions or would like further information on the Census of Governments, please call 1-800-242-2184 or via e-mail at govs.cms.inquiry@census.gov.  General information and data can also be obtained at http://www.census.gov/govs/

6/27/2011 – Webinar on the New American FactFinder

The U.S. Census Bureau will hold a webinar on the new data delivery tool, American FactFinder. During this comprehensive 30-minute tutorial, an expert on the use of American FactFinder will demonstrate how to locate, access, manipulate, map and download Summary File 1 for states and other previously released 2010 Census data.

The webinar will consist of a simultaneous audio conference and online presentation. Reporters will be able to ask questions during the audio conference once the tutorial is complete.

When:

Monday, June 27, 2011, 1 p.m. (EDT)

Who:

Jackie J. Mommsen, program analyst, Requirements and Stakeholder Relations

Branch, Decennial Systems Contract Management Office

Details:

Audio conference — access information

Toll free number: 888-603-9635
Participant passcode: AFF

Online presentation — access information

Please login early, as some setup is required.

URL: <https://www.mymeetings.com/nc/join/>

Conference number: PW5665280

Audience passcode: AFF

Census Bureau to Release 2010 Census Summary File 1 for Connecticut on Thursday June 30

Next week, the U.S. Census Bureau will release the 2010 Census Summary File 1 for Alaska, Colorado, Connecticut, Nebraska and North Carolina. During June through August, the Census Bureau will provide statistics for states each week on a flow basis. These Summary File 1 tables will provide the most detailed information available so far from the 2010 Census, including cross-tabulations of age, sex, households, families, relationship to householder, characteristics of owners and renters, detailed race and Hispanic or Latino origin groups, and group quarters.

The Summary File will be available for each of the 50 states, the District of Columbia and Puerto Rico. The information will be available for a variety of geographic areas, with most tables available down to the block or census tract level.

When:

The Summary File 1 for these states will be available on an embargoed basis for accredited media who are registered for access on Tuesday, June 28 at 10 a.m. The embargo will be lifted and the information released publicly on Thursday, June 30 at 12:01 a.m.

To apply for embargo access, go to our Newsroom at <http://www.census.gov/newsroom> and click on “Embargoed Releases.” Please review the Embargo Policy carefully before submitting the embargo registration form.

Online Press Kit:

For more information about the release of Summary File 1, please visit <http://2010.census.gov/news/press-kits/summary-file-1.html>

55 Percent Have Married One Time According the US Census Report

Among all people 15 and older in 2009, 55 percent had been married once, with 30 percent never having been married at all, according to a U.S. Census Bureau report released today. At the same time, 15 percent had married more than once, including 12 percent who had married twice and 3 percent who had married three or more times.

“The findings come from Number, Timing, and Duration of Marriages and Divorces: 2009 [PDF], which uses data from the Survey of Income and Program Participation to provide a look at topics such as changes in the age at marriage, divorce and remarriage over the years, how long first marriages last, people who have been married multiple times, those who have been divorced or experienced other marital events, and the percentage of currently married couples that include spouses who are both in their first marriage.

Click to view more details on this report

New American FactFinder Workshops at Stamford and Torrington Campuses

Are you interested in learning more about using the New American FactFinder to access data from the 2010 U.S. Census? The Connecticut State Data Center is offering a series of workshops across the state to provide users with an opportunity to learn more about the New American FactFinder in a hands-on workshop environment. Included below are the upcoming workshops, and we will be offering additional workshops at more locations soon.

Locating Census 2010 Data using the NEW American FactFinder

The U.S. Census Bureau introduced a NEW American FactFinder online Census data tool with enhanced searching and data display capabilities in conjunction with the release of 2010 Census data. In this workshop you will learn how to use the new American FactFinder to locate and download data – and create thematic maps – from a wide variety of population, economic, and housing information in the 2010 and 2000 decennial Censuses. From information on individual neighborhoods or zip codes, to state- or national-level data, the new American FactFinder is a powerful tool for navigating the vast amounts of data made available by the U.S. Census Bureau. The new American FactFinder will also soon replace the legacy American FactFinder as the platform for retrieving data from the American Community Survey (the ongoing Census program which produces data on educational attainment, income, occupation, marital status, and other detailed social and economic characteristics), and will also deliver data from the Economic Census. Join us to learn more about how to effectively navigate the NEW American FactFinder.

University of Connecticut Stamford Campus

Wednesday 07/06/11 11:00 AM to 12:30 PM Stamford Campus – Computer Lab 306 12 4 Register

Wednesday 07/06/11 1:00 PM to 2:30 PM Stamford Campus – Computer Lab 306 12 2 Register

University of Connecticut Torrington Campus

Monday 07/11/11 11:00 AM to 12:30 PM Torrington Computer Lab (Room 126) 25 4 Register

Monday 07/11/11 1:00 PM to 2:30 PM Torrington Computer Lab (Room 126) 25 2 Register

More workshops coming soon!

To keep current on the latest Census, Mapping, and Workshop offerings check out the Connecticut State Data Center’s website (http://ctsdc.uconn.edu) and follow our blog (http://outsidetheneatline.blogspot.com)