Census Bureau Releases First Information Since 2000 Census on Moves Between Counties

Census Bureau Releases First Information Since 2000 Census on Moves Between Counties

Maricopa, Ariz., Receives Movers From and Sends Them to Largest Collection of Counties

The U.S. Census Bureau released estimates from the American Community Survey showing how many people migrated from one specific county to another during the course of a year ─ the first such numbers published since these data were collected as part of the 2000 Census.

The American Community Survey compiles data over a five-year period and asks people where they lived one year prior to being surveyed. The first five-year estimates released covers the years from 2005 to 2009.

The 2005-2009 American Community Survey County-to-County Migration Files provide tables for each county in the nation, showing both “inflows” and “outflows.” Inflows are the number of people living in a given county who lived in another specific county one year earlier; outflows represent the number of people who lived in a particular county one year earlier who subsequently moved to another specific county.

Of the 48.1 million people who lived in a different residence in the United States one year earlier, 17.7 million lived in a different county.

Maricopa, Ariz., had the largest number of inflows of people for any single county in the nation. People moved there from 993 different counties. Similarly, Maricopa led the nation with the largest number of counties in which it sent outflows of people ─ a total of 1,156 counties. This means that individuals leaving Maricopa were more dispersed throughout the country than individuals leaving any other county. Pinal, Ariz. (13,452 residents); Los Angeles (12,403); Pima, Ariz. (7,349); San Diego (6,693); and Coconino, Ariz. (3,994) were among the counties with the highest number of people moving into Maricopa.

Pinal (21,974), Pima (8,464), San Diego (4,156), Los Angeles (3,813) and Coconino (3,188) were among the counties with the highest number of moves out of Maricopa.

All in all, the most common county-to-county moves nationally were from Los Angeles to San Bernardino, Calif. (48,456 people) and Los Angeles to Orange, Calif. (41,612). Los Angeles to Riverside, Calif. (29,710); Orange, Calif., to Los Angeles (29,345); and Miami-Dade to Broward, Fla. (27,010) were among the next most common county-to-county moves.

Additionally, Los Angeles had both the highest number of people entering from another county as well as the highest number leaving for another county. On balance, however, it lost a net of about 160,000 people in this exchange.

Prior to this product, the only migration flow tables available from the American Community Survey covered state-to-state flows; the latest such release, from the 2010 one-year estimates, was published in November 2011. Later this year, the U.S. Census Bureau plans to release a file from the 2006-2010 American Community Survey five-year estimates showing county-to-county flows by demographic characteristics, such as age, sex, and race and Hispanic origin.

2006-2010 American Community Survey (ACS) 5 Year Data now available

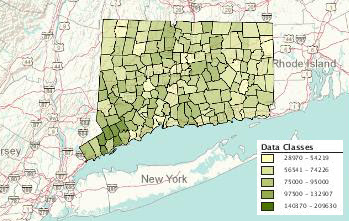
The United States Census Bureau has released the 2006-2010 American Community Survey (ACS) 5 year estimates! This dataset includes updated socio-economic statistics covering every community in the nation, including all 169 towns in Connecticut. Included below are some examples of the data variables available from the 2006-2010 American Community Survey (ACS) 5 year estimates for Connecticut:

Median Household Income (2006-2010) by Town in Connecticut:

Click the map above to view interactive map

View Median Income Data by Town in Connecticut

Ratio of Income to Poverty Level for Families (under .5) (2006-2010) by Town in Connecticut:

Click the map above to view interactive map


View Ratio of Income to Poverty Level for Families Data by Town in Connecticut
 

How can I access the 2006-2010 ACS 5 year estimates data?
The American FactFinder provides access to the 2006-2010 ACS 5 year estimates data for Connecticut as well as the entire nation. From the American FactFinder users can search datasets, download datasets, and create interactive maps based on variables from the ACS.

At what geographic levels is the data available?
The ACS 5 year data is available at the national, state, congressional district, county, county subdivision (town), tract, and block group level. For those users interested in examining block group level data the margin of error values could be significant at the block group level so be sure to review the margin of error values closely as tract level data may provide less error.

Comparing ACS data to 2010 Census
For additional details on the American Community Survey and when/if comparisons of the data can be made to the 2010 census visit: http://www.census.gov/acs/www/guidance_for_data_users/comparing_data/

What if I have questions about using the ACS? 
Contact the Connecticut State Data Center at ctsdc@uconn.edu  and we will be happy to assist.

The Holiday Season in Numbers

Here are some statistics from the U.S. Census Bureau for the holiday season:

$27.2 Billion – Value of retail sales in the nation’s department stores in December 2010

$34 Billion – Value of retail sales via electronic shopping and mail-order houses in December 2010

$983 Million – Value of U.S. imports of Christmas tree ornaments from China between January and September 2011

$2.5 Billion – The value of U.S. toy imports including stuffed toys, puzzles, and electric trains from China between January and September 2011.

50% – Proportion of nations potatoes produced in Idaho and Washington in 2010

$1.5 Billion – Value of product shipments of candles in 2009 by the nation’s manufacturers

Happy Holidays!


Census Bureau Webinar to Highlight Migration Data – November 15, 2011

What:
The U.S. Census Bureau will hold an audio news conference to release four migration-related data products. Statistics from the Current Population Survey and American Community Survey examine topics including the likelihood of people moving and how this rate has changed over time, the reasons people move, how common it is for people to live in their state of birth, and the most common sets of state-to-state moves.

The news conference will consist of a simultaneous audio conference and online presentation. Information on accessing the online presentation is provided below. Reporters will be able to ask questions once the presentation is complete. We suggest reporters log in and call in early.

 
When:
Tuesday, Nov. 15, 2011; 10 a.m. (EST)
 
Who:
Alison Fields, chief, Journey-to-Work & Migration Statistics Branch, U.S. Census Bureau
William H. Frey, senior fellow, Metropolitan Policy Program, Brookings Institution
 
Details:
Audio conference ― access information
Toll free number: 888-989-7686
Passcode: CENSUS
Note: Stay on the line until operator asks for the passcode. Do not key in passcode.

Online presentation ― access information
Please login early, as some setup is required.

URL: https://www.mymeetings.com/nc/join/
Conference/meeting number: PW8836688
Conference/meeting passcode: CENSUS
If closed captioning required: http://livewrite.nccsite.com/view/cb1115

Experimental Poverty Measures Public Use Research File and Release of Supplemental Poverty Measure Research

The Census Bureau has released a microdata file that permits users to create tables updating the National Academy of Sciences’ experimental poverty estimates. This file will permit users to construct 2010 estimates. These estimates are different from the supplemental poverty measure, which is the topic for a Nov. 4 technical webinar. On Nov. 7, at a Brookings Institution seminar, the Census Bureau will release a supplemental poverty measure that complements, but does not replace, the official measure. This measure is the product of years of research and collaboration with other organizations, such as the National Academy of Sciences and the Bureau of Labor Statistics. A Census Bureau subject-matter expert will discuss supplemental poverty measure results and methodology at the seminar. 


The microdata released on October 27, 2011 are available at: http://www.census.gov/hhes/povmeas/data/public-use.html.

Demographic Resources from Cornell University

The Cornell University Program on Applied Demographics (PAD) website possesses some great Census related resources. The first is a margin of error calculator for American Community Survey data which was created based on this U.S. Census Bureau document. The calculator allows you to enter values and operations in order to compute new margins of errors or test for significance of the difference between values.

Second, if you are looking for maps of current demographic data for the state of New York, then this site’s Census 2010 Atlas will be especially helpful. It has an easy to use index that allows users to choose what map to display. Once the map is displayed you can easily download a professionally prepared map in the form of a JPEG file.


The PAD website also has additional resources including white papers, presentations and more.

2010 Guide to State and Local Census Geography

Ever wanted to know what the historical center for population in a state based on decennial census data? Check out the 2010 Guide to State and Local Census Geography includes a quick summary of 2010 Census data based on geography. Check out these reports at: http://www.census.gov/geo/www/guidestloc/guide_main.html

Below is a quick example of some of the data available for Connecticut

CONNECTICUT CENTERS OF POPULATION

http://www.census.gov/geo/www/2010census/centerpop2010/historical/historical_cenpop_09.html

Year North Latitude West Longitude
20106 41° 29′ 49″ 72° 52′ 13″
20006 41° 29′ 41″ 72° 52′ 28″
19905 41° 29′ 49″ 72° 52′ 10″
19804 41° 29′ 26″ 72° 52′ 34″
19703 41° 29′ 17″ 72° 52′ 38″
19603 41° 32′ 11″ 72° 53′ 00″
19503 41° 30′ 33″ 72° 52′ 57″
19402 41° 32′ 12″ 72° 53′ 29″
19302 41° 32′ 11″ 72° 53′ 22″
19201 41° 30′ 08″ 72° 51′ 47″
19101 41° 30′ 54″ 72° 50′ 20″
19001 41° 31′ 23″ 72° 49′ 06″
18901 41° 31′ 41″ 72° 48′ 00″
18801 41° 32′ 49″ 72° 46′ 21″
1  Source:  U.S. Department of Commerce, Bureau of the Census, Fourteenth Census of the United States, 1923
2  Source:  U.S. Census Bureau, recomputation for historical county level data which relied upon aggregate county level population data with an estimated county centroid resulting in a possible error of up to one mile.
3  Source:  U.S. Department of Commerce, Bureau of the Census, Centers of Population for States and Counties, 1974
4  Source:  U.S. Census Bureau, Geography Division, recomputation from archived national block group/enumeration area data resulting in a possible error of up to 1,000 feet.
5  Source:  U.S. Census Bureau, Geography Division, recomputation from archived national block group data resulting in a possible error of up to 1,000 feet.
6  Source:  U.S. Census Bureau, computation from national block-level data

The Uninsured Population of Connecticut

One of the variables measured in the 2010 American Community Survey is the number of people who do not have health insurance. In order to find statistics related to the uninsured population in Connecticut, I downloaded two tables from the American Fact Finder: Health Insurance Coverage Status (Table S2701) by state and by Connecticut counties, respectively. Connecticut has a relatively low percentage of the population that is uninsured; it ranks fourth out of the fifty states in the country (see table below). Out of the counties in Connecticut (see map above), Fairfield County has the highest percentage (11.7%) while Tolland County has the lowest percentage (5.1%). 
Percentage of state populations that are uninsured from the 2010 American Community Survey 1 Year Estimate

Webinar – Taxes: More Than Just Income & Sales – October 26, 2011 from 2-3pm

Webinar – Taxes: More Than Just Income & Sales

When: October 26, 2011
Time: 2:00pm-3:00pm

Description: This webinar is the second installment of Association of Public Data Users (APDU)’s webinar series on the Census of Governments.  This session will explain how the Census Bureau classifies and assigns tax revenues, what it publishes, and how the data is used for policy and macroeconomic analysis outside of the Census Bureau.

Presenters:

Cheryl H. Lee
Branch Chief
State Finance and Tax Statistics Branch, Governments Division
U.S. Census Bureau

Kim Rueben
Senior Fellow
Tax Policy Center
Urban Institute

Christopher Hall
Administrator
Tax Analysis Division
Ohio Department of Taxation

Cost: Free Click here to Register

Geography Awareness Week Kickoff Event – November 3, 2011 @ UConn

Geography: The Adventures in Your Community
Thursday, November 3, 2011 4:45-8:00pm
Thomas J Dodd Research Center at UConn
Storrs, Connecticut
The heart of this year’s theme will revolve around a series of topics that encourage individuals or teams of students, families, or friends to explore their own communities through geographic eyes, and challenge them to look at things from a geographic perspective.
Program Agenda
4:00-4:30 Pre-conference tour of UConn Libraries – MAGIC
4:30-4:45 Registration – Thomas J. Dodd Research Center
4:45-5:00 Welcome – Bill DeGrazia & Tom Brodnitzki, CGA Co-Coordinators
5:00-6:00 Keynote Speaker – Arthur Bakis – U.S. Census Bureau Boston Regional Office
6:05-6:55 Buffet Dinner and Remarks
7:00-7:50 Breakout Sessions
I – Elementary Teachers – Allyson Lubs, Professional Development CGA
II – Middle & High School Teachers – Kristie Blanchard, NE Geography Teacher of the Year
III – Exploration of American Community Survey (ACS) –
Michael Howser, Connecticut State Data Center
7:50-8:00 CEU Records and Drawings

Participation Fee: $25 (add $10 if you would like to be awarded .3 CEUs upon completion of the program). The fee includes registration and a light dinner. Checks should be made payable to “Connecticut Geographic Alliance.
Pre-Service Teachers receive a reduced registration fee of $10 and currently enrolled UConn Students receive free admission.
This workshop is a collaboration of the Connecticut Geographic Alliance, University of Connecticut Department of Geography, University of Connecticut Libraries Map and Geographic Information Center (MAGIC), and the Connecticut State Data Center.
To register for this event download the Registration form.