June 10, 2011 – CT GIS User to User Network Meeting on the 2010 U.S. Census

The Connecticut GIS User to User Network will hold its quarterly meeting on June 10, 2011 at the University of Connecticut’s Greater Hartford Campus from 9am – 12 pm. This meeting will focus on topics related to GIS and the 2010 U.S. Census and will feature presenters from the U.S. Census Boston Regional Office. This meeting will be held in the Information Technology Building Room 104 at the University of Connecticut Greater Hartford Campus. Included below is a tentative outline:

Tentative Outline

9:00-9:15am – Introductions

9:15 – 9:45am – Locating 2010 Census Data using the New American FactFinder

9:45 – 10:00am – Tips and Tricks

10:00 – 10:15am – Networking

10:15 – 10:45am – Using 2010 Shapefiles and joining data from the 2010 Census

10:45 – 11:00am – Break

11:00 – 11:45am – American Community Survey and comparing ACS with 2010 Census data

11:45am – 12:00pm – Question and Answer Session

Parking and Navigating Campus

Parking is available for free in the visitor lot at the corner of Ayslum Ave and Trout Brook Drive in West Hartford, CT. Once on campus, the Information Technology Center is a short walk from the Parking Lot. The following link includes a campus map that includes details on each building: http://hartford.uconn.edu/map/campus.html

For Driving directions to the University of Connecticut Greater Hartford Campus, visit the following website: http://hartford.uconn.edu/map/

Can’t Make it? Attend this meeting Virtually!

For those that are unable to attend this meeting in person, a live web stream from this meeting will be offered. If you are interested in attending this meeting virtually via a live web stream, please complete the following form so we can be sure to provide you a link to attend the meeting virtually: http://bit.ly/lHuOM9

GIS Tips and Tricks

CT GIS User to User Network would also like to encourage participants to bring a GIS related tip to share with meeting participants. These tips could include a favorite extension, script, and time saving resource that would be useful to other meeting participants. Feel free to bring your tip on a sheet of paper to share with other meeting participants.

We look forward to seeing you physically or virtually for this meeting on the June 10, 2011!

6/2/2011 – Census Bureau to Hold Webinar Prior to Release of 2010 Census Summary File 1 for States

The U.S. Census Bureau will hold a webinar on June 2, 2011 at 2:30pm prior to the state-by-state releases of the 2010 Census Summary File 1 in June through August. You will learn about the topics to be released in the summary file, how the release process will work and how to access the data.

The webinar will consist of a simultaneous audio conference and online presentation. You will be able to ask questions during the audio conference once the presentation is complete.

Presenters include: Louisa Miller, assistant division chief, Census Programs, Population Division & Rob Chestnut, chief, Requirements and Stakeholder Relations Branch, Decennial Systems Contract Management Office

Details: Audio conference — access informationToll free number: 888-769-8716
Participant passcode: 2010 CENSUS

Online presentation — access information
Please login early, as some setup is required.URL: https://www.mymeetings.com/nc/join/
Conference number: PW7852082
Audience passcode: 2010 CENSUS

If closed captioning is required: http://livewrite.nccsite.com/view/cb0602

More information available at: https://www.mymeetings.com/nc/join/

US Census Update on Finances of Selected State and Local Government Employee Retirement Systems

The Fourth Quarter 2010 Report of the US Census Bureau’s Finances of Selected State and Local Government Employee Retirement Systems is now available.

The U.S Census Bureau’s Finances of Selected State and Local Government Employee Retirement Systems is a quarterly survey that provides national summary data on the revenues, expenditures, and composition of assets of the largest state and local government employee retirement systems. This survey currently consists of a panel of 100 retirement systems, which comprise 89.4 percent of financial activity among such entities, based on the 2007 Census of Governments.
To view this report visit: http://www.census.gov/govs/qpr/ and below are links to the data included in this report.

Table Description File Formats
1 Cash and Security Holdings of Major Public Employee Retirement Systems, by Type HTML [TXT, 5KB] [XLS, 29KB]
2 Receipts, Benefits, and Withdrawal Payments of Major Public Employee Retirement Systems HTML [TXT, 5KB] [XLS, 29KB]
3 Percent Distribution of the Cash and Security Holdings of Major Public Employee Retirement Systems Shown in Table 1 HTML [TXT, 5KB] [XLS, 30KB

US Census Bureau Fourth Quarter 2010 Summary of State and Local Tax Revenue

The US Census Bureau has released the Fourth Quarter 2010 Summary of State and Local Taxes.

The Quarterly Summary of State and Local Government Tax Revenue provides quarterly estimates of state and local government tax revenue at a national level, as well as detailed tax revenue data for individual states. This quarterly survey has been conducted continuously since 1962. The information contained in this survey is the most current information available on a nationwide basis for government tax collections.

To view this entire report visit: http://www.census.gov/govs/qtax/

Fourth Quarter 2010 Data for US Manufacturing, Mining, Wholesale Trade, and other industries


The latest version of the U.S. Census Quarterly Financial Report is now available. For over sixty years, the Quarterly Financial Report – QFR program has collected and published quarterly aggregate statistics on the financial results and position of U.S. corporations. This report includes:

  • Corporations that have a plurality of business activity in manufacturing industries, and domestic assets of $250,000 and over.
  • Corporations that have a plurality of business activity in mining, wholesale trade, retail trade, or selected service industries, and domestic assets of $50 million and over.
  • Corporations that are above industry specific receipt cut-off values.
  • The statistical data are classified by industry and by asset size.
  • Currently, the QFR program covers the following industry sectors, as defined by the North American Industry Classification System (NAICS):
    • Mining 211-213
    • Manufacturing 311-316, 321-327, 331-337, 339
    • Wholesale Trade 423-425
    • Retail Trade 441-448, 451-454
    • Selected Service Indistries 511-512, 515, 517-519, 541 (except 5411 Legal Services)
To view the 4th Quarter 2010 Quarterly Financial Report for Manufacturing, Mining, Wholesale Trade, and Selected Service Industries visit: http://www.census.gov/econ/qfr/

US Census: Consumer Expenditure Survey

Since 1979, the Census Bureau’s Consumer Expenditure Survey has supplied the nation with household data used to help compute the Consumer Price Index, a key measure of the economy released by the U.S. Bureau of Labor Statistics. In April 2011, the next round of interviews takes place for this quarterly survey. The survey collects information [PDF] on spending for housing, groceries, health care, transportation and other vital goods and services. To see the latest data available and additional details visit: http://www.bls.gov/cex/.

Household Expenditures for Shelter: 2008-2009

Average Annual Amount Spent on Shelter Percent of Total Expenditures
United States $10,129 20.3%
Northeast $11,984 22.0%

New York

$15,482 25.7%

Philadelphia

$13,597 23.9%

Boston

$12,857 21.7%

Wildlife Recreation Information Survey by US Census Underway

On April 1, 2011, U.S. Census Bureau employees began the first wave of data collection for the National Survey of Fishing, Hunting, and Wildlife-Associated Recreation from about 53,000 households across the country.

Conducted every five years by the Census Bureau, the survey is sponsored by the U.S. Fish and Wildlife Service.

“Participation in this survey is important because the results help us better manage our natural resources and to understand the demands being put on our wildlife and their habitat,” said Robert Groves, director of the Census Bureau. “This is one of the many surveys conducted by the Census Bureau for other federal agencies.”

The information collected for this survey focuses on individuals involved in fishing, hunting and other wildlife-associated recreation, such as observation, photography and feeding.

The latest data from the survey show that in 2006, more than 87 million Americans 16 and older enjoyed some form of wildlife-related recreation and spent $122 billion in pursuit of these activities.

The questions ask in which state these activities occurred and focus on such items as the number of trips taken, duration of trips and expenditures for food, lodging, transportation and equipment. Federal and state agencies use this knowledge for conservation efforts and to maintain areas where we go for outdoor recreational activity.

Preliminary survey findings will be available in summer of 2012. The final national report will be issued in the fall of 2012, followed by a report for each state.

Data collection began on April 1, 2011. Respondents will be surveyed primarily by telephone. Residents will receive a letter from Groves informing them of the survey. All information collected is kept strictly confidential and only statistical totals are published.

The National Survey of Fishing, Hunting, and Wildlife-Associated Recreation has been conducted since 1955 and is one of the oldest and most comprehensive continuing recreation surveys.

To view previous survey reports and data visit: http://www.census.gov/prod/www/abs/fishing.html

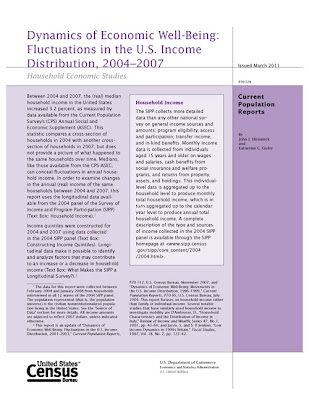
US Census Report: Fluctuations in the U.S. Income Distribution: 2004-2007

This U.S. Census report divides the nation’s 106 million households into quintiles of 21.3 million based on income and compares their characteristics and their movements between and within the quintiles. Using data from the Survey of Income and Program Participation (SIPP), the report traces the changing income levels of a representative sample of U.S. residents over a 48-month period (February 2004 to January 2008). These households were interviewed every four months over this time.

View the full report in PDF format at: http://www.census.gov/prod/2011pubs/p70-124.pdf

2010 Census Redistricting (Public Law 94-171) shapefiles now available

Thanks to the efforts of Jeffrey Dunn & Jie Lin at the Connecticut State Data Center and Will Carnes and Josh Strunk at the UConn Libraries Map and Geographic Information Center – MAGIC, shapefiles are now available for the 2010 U.S. Census Redistricting (Public Law 94-171) dataset for Connecticut. These shapefiles incorporate the data and are available in both Connecticut State Plane NAD 83 and WGS 1984 projections. Included below is a listing of the geographies available for download in shapefile as well as spreadsheet formats.

Each of these shapefiles include FGDC metadata which defines each attribute and users can also download the spreadsheet data which includes a codebook for these attributes. To download these files visit the Connecticut State Data Center’s data download page at:
We would also like to feature maps on the MAGIC and Connecticut State Data Center websites that included 2010 U.S. Census Redistricting (Public Law 94-171) Data created by you! If you have a great map you would like to share email us at ctsdc@uconn.edu.

Mean Center of Population Based on 2010 Census data

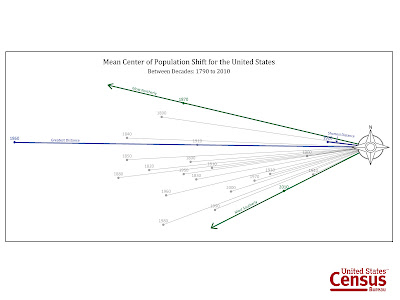
The United States Census Bureau released the Mean Center of Population for the 2010 Census on Thursday, March 24, 2011. Based on the 2010 Census, the Mean Center of Population in the United States is…… 2.7 miles northeast of Plato, Missouri. Included below is a map that shows the the mean center of population from 1790 to 2010:

The US Census Bureau also provided a visualization of the movement of the Mean Center of Population over time with the 2010 Census representing the furthest shift to the south of the Mean Center of Population in the United State since the first census in 1790. Included below is an visualization of the shift from 1790 to 2010:

For additional details on the Mean Center of Population press release visit: