Web and mobile application development at the Census Bureau

The Census Bureau is keeping up to speed with not only different types of statistics and data, but how users and developers can access and visualize that data in more meaningful and streamlined ways.

The Census Bureau was recently named a 2013 Honors Laureate by Computerworld for development of its open data API, an application programming interface implemented in July 2012 that allows developers to take data sets and reuse them to create online and mobile apps – for more information see: http://www.census.gov/developers/

The Bureau was recognized by the magazine “for its visionary applications of information technology promoting positive social, economic and educational change.” The story will be featured in the June 3 edition of Computerworld.

Recently, the Bureau developed a new mobile app that allows users to “take the pulse of the U.S. Economy” straight from their phone! According to the Bureau:

The America’s Economy app provides real-time updates for 16 key economic indicators released from the U.S. Census Bureau, Bureau of Labor Statistics, and Bureau of Economic Analysis. Key economic measures on employment, manufacturing, international trade, retail sales, and residential construction and sales allow those who follow the U.S. economy to be the first to see whether the indicator has gone up or down since the previous report, and trends over time.


Learn more about this app by using the link above, or click one of the following to download:

AmEcAppApple
Download iPhone Version
Download iPad Version

Android
Download Phone Version
Download Tablet Version


Key Features

  • Quick overview of indicators measuring the U.S. economy
  • Detailed page for each indicator with trend data
  • Share indicators on Facebook, Twitter and via email
  • View release schedules for indicators
  • Set up notifications and custom views
Indicators
  • Advance Monthly Retail Sales
  • Advance Report Durable Goods
  • Business Inventories
  • Construction Spending
  • Homeownership Rate
  • International Trade
  • Manufacturers’ Goods
  • Monthly Wholesale
  • New Residential Construction
  • New Residential Sales
  • Personal Income
  • QFR–Manufacturing
  • QFR–Retail Trade
  • Quarterly Services Survey
  • Real Gross Domestic Product
  • Unemployment Rate

Additionally, the Census Bureau’s website is home to many different web-based mapping applications that provide excellent visualizations of data. One example is the US County Migration Patterns map, available here: http://flowsmapper.geo.census.gov/flowsmapper/map.html  USMigrationMap

or the 2010 Census Interactive Population map, available here: http://www.census.gov/2010census/popmap/

Censuswebapp

Call for presentations, Spring 2013 NEARC conference

Spring NEARC Conference – Call for Presentations (DEADLINE EXTENDED TO MONDAY APRIL 1, 2013)

Tuesday, May 14, 2013

University of Massachusetts at Amherst

Spring NEARC is an annual, one-day conference held near the center of the NEARC region. The day is packed with professional development and networking opportunities for all levels of GIS users.

NEARC is now accepting presentation submissions for the spring conference. Click here to learn about format options and to submit your workshop, lightning talk, presentation, panel, or poster. Presentations will only be accepted until Friday, March 22.

Conference highlights include:

• Workshops

• Lightning Talks

• GIS Karaoke

• ArcGIS 10.1 Update

• Pub Social

A schedule of the day will be available soon. Please visit the NEARC website for updates.

For information about last year’s conference please see:

http://www3.amherst.edu/~aanderson/nearc/schedule2012.html


East Coast Power Outage Maps

https://www.ssd.noaa.gov/goes/east/eaus/rb-l.jpg
From the National Hurricane Center

As Hurricane Sandy approaches the Mid-Atlantic and New England here are some online resources to keep track of power outages.  We know that if you lose power these sites will be of little help, but you could share them with friends and relatives at a distance so they can give you updates.

Virginia:
Dominion Electric 

Maryland:
Maryland Power Outages 

Delaware:
Delmarva Power 
Delaware Electric Co-op 

District of Columbia:
Pepco

New Jersey:
Jersey Central Power and Light
PSE&G

Pennsylvania:
Multiple Carriers from First Energy

New York:
ConEdison
National Grid (Upstate)
Long Island Power Authority (LIPA)

Connecticut:
Connecticut Light & Power
United Illuminating Company

Rhode Island:
National Grid

Massachusetts:
National Grid
Western Massachusetts Electric

Vermont:
Vermont Outages

New Hampshire:
Public Service of New Hampshire
New Hampshire Electric Co-op

Maine:
Central Maine Power 

As always never forget to check with the National Weather Service and the National Hurricane Center for further update.  Be safe!

National Historical GIS of the Minnesota Population Center releases time series Census data

The National Historical Geographic Information System has recently announced its initial release of time series tables of U.S. Census data.

Freely available to the public through the NHGIS Data Finder, these datasets provide aggregated tables of statistics comparable across time, and for many scales of geographic area. For instance, the initial data release includes 100% population count data from every Decennial Census since 1790 at the state and county levels, while providing such data down to the Census tract and place levels for the 1970 through 2010 Decennial Censuses.

Time series data can be viewed and downloaded in layouts differentiated either by file (one file for each time point of data, encompassing all geographic units) or by row (one file for all geographic units, with each time point occupying a row of data). Future data releases will not only provide column-differentiated time series data, but will also incorporate the American Community Survey datasets.

The National Historical Geographic Information System is a free-of-charge and public-accessible service of the Minnesota Population Center, a demographic research center at the University of Minnesota.

GIS in the Cloud Virtual Meeting – October 12, 2012 from 9-10:30am

The Connecticut GIS User to User Network virtual meeting on GIS in the Cloud will be this Friday, Oct. 12, 9:00 AM- 10:30AM.  There will be three GIS cloud users presenting and two GIS cloud service providers.

The meeting can be viewed live starting at 9:10am on October 12, 2012 at: http://youtu.be/F69upDZDyfQ


A link to the webcast will also be included in this blog post at the start of the meeting. We will handle questions using ctgisu2un@gmail.com ,the Network’s e-mail account.

If you cannot make the meeting a link to that video will be on the Network’s home page http://ctgis.uconn.edu/for later viewing.  
Also, check out the two new Google Map web sites for the Connecticut GIS User to User Network:
Map of Members: 
To add yourself to the map!
A map of town GIS status from a survey done by Meghan McGaffin (Milford) last year.

Connecticut GeoFocus – Fall 2012 Issue

The Connecticut GIS User to User Network and the Connecticut GIS Council Education and Outreach Working Group’s latest issue of GeoFocus, CT’s Quarterly Geospatial Newsletter is now available. Included below are just a few highlights from the Fall 2012 (September) issue:

  • New! EOC Web Viewer
  • Essay: GIS and Cartography
  • Greatest Paper Map of the US
  • 10 Tips on Making and Effective Poster
  • Mapping for Flood Mitigation
  • Letter from Thad Dymkowski – President of the Connecticut GIS User to User Network
  • And more!
Check out the latest issue today!
Interesting in contributing to CT GeoFocus?
If you are interested in submitting articles for the next issue of GeoFocus, details are provided on page 1 of the newsletter. 

Connecticut GIS Day – November 16, 2012 at UConn Avery Point Campus

Mark your calendars! Connecticut GIS Day 2012 – November 16, 2012

This year’s Connecticut GIS Day event is scheduled for Friday, November, 16, from 9 AM to 3 PM at the Marine Sciences Building at the University of Connecticut Avery Point Campus. The keynote speaker will be DANA TOMLIN, credited with the creation of Map Algebra! If you were lucky enough to attend the Spring NEARC event at Smith College and hear his presentation, then you already know that Dana is well worth hearing! This is also a great venue to present a poster or presentation as well as network with GIS users from state agencies, regional planning agencies, municipalities, non-profits, universities, and organizations from across the state of Connecticut. Included below are details on the call for posters, presentations, and table displays:
CALL FOR POSTERS & PRESENTATIONS
We are officially launching our call for presentations and posters for GIS Day. The presentations should discuss a GIS project, tool, custom process, or similarly themed topic. We are looking for a 15 minute presentation with 5 additional minutes for questions and answers. Posters are also sought. They must be mounted on some sort of rigid material (i.e. foam board, etc.), approximately 24” x 36” in size (slightly larger will be accepted, but no smaller). Also, NEW this year, we are looking for poster presentations (5 minutes in length) from GIS or related subject students from Connecticut Universities. If you are looking for GISP points, this could be a great way to add to your total!
CALL FOR TABLE DISPLAYS
We are asking for interested parties that wish to host a table to display information. This is open to anyone this year! We ask that your display maintain an educational theme. Show us how you use GIS in your organization or group!

If you are interested in participating or have additional questions, please feel free to Thad Dymkowski at TDymkowski@NewingtonCT.Gov

GeoFocus Summer 2012 Now Available

The Connecticut GIS User to User Network and the Connecticut GIS Council Education and Outreach Working Group’s latest issue of GeoFocus, CT’s Quarterly Geospatial Newsletter is now available. Included below are just a few highlights from the Summer 2012 (June) issue:

  • Editorial: Data Sharing Law Passes!
  • Using Smartphones to Maintain Streetlights
  • Connecticut Orthophoto Update
  • Census Q&A
  • Measure Tree Canopy
  • New Population Projections for Connecticut
  • State POCD Map Changes
  • Letter from Thad Dymkowski – President of the Connecticut GIS User to User Network
  • And more!
Check out the latest issue today!
Interesting in contributing to CT GeoFocus?
If you are interested in submitting articles for the next issue of GeoFocus, details are provided on page 2 of the newsletter. Articles for the next issue are due by 8/30/2012.

Visualizing the pay gap: educational attainment & income data from the American Community Survey

Each year the Census Bureau’s American Community Survey provides dozens of tables of interesting data related to education – tracking enrollment in public and private schools, the number of individuals holding bachelor’s degrees in various fields, and cross-tabulating educational levels with characteristics as diverse as place of birth, mobility and race. Data on the relationship between educational attainment and income are available in table S1501 of the ACS. Based on the data in that table, the thematic map and chart below illustrate the relationship between education and income, as well as the gap in income between men and women with equivalent levels of educational attainment – from those with less than a high school diploma to those with a graduate or professional degree.

<a href=”undefined”><img alt=”Dashboard 1 ” src=”http://public.tableausoftware.com/static/images/Ea/EarningsbyEducationalAttainment2010/Dashboard1/1_rss.png” style=”border: none” /></a>

Hurricane Visualizations – 1851 to Present

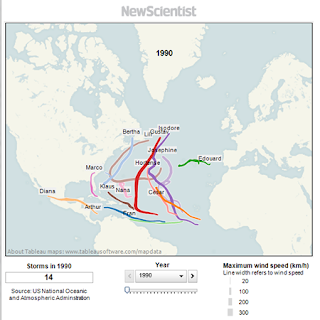
With hurricane season upon us, the New Scientist has developed a visualization of the path of hurricanes for the past 20 years. Explore year by year the path of each hurricane, view the total number of storms for each year, and each visualization includes the maximum wind speed for each storm.

As you explore this article further you will discover that 2005, the same year that Katrina and Rita caused so much damage to the gulf coast, there were a total of 28 storms. These 28 storms in 2005  resulted in just over 1,000 casualties, representing the highest number of hurricane related deaths over this 20 year period.

Review this article and view 1990-2010 Hurricane Visualizations at:
http://www.newscientist.com/blogs/shortsharpscience/2011/05/prepare-for-hurricane-season.html

Want To Explore More Hurricane Data?
The National Oceanic and Atmospheric Administration (NOAA) has developed an interactive interface to enable users to explore Historical Hurricane Tracks which can be explore by location, storm name, and ocean basin. This interface allows users to view storms from the late 1800s to present and includes barometric pressure readings, wind speeds, storm category, and more details plus the ability to download the data. This visualization can be viewed at: http://csc.noaa.gov/hurricanes/

The NOAA Historical Hurricane Tracks also allows users to refine their search by storm category, time frame, and even barometric pressure. This interface provides great visualizations of the life cycle of a hurricane and provides an interactive display of the path of the hurricane.

More Resources to Explore
Want to explore more details about hurricanes and historical hurricane visualizations? The following links include some additional resources related to hurricanes: