Did You Know #20 David Rumsey Map Collection

If you love exploring historical maps then be sure to check out the newly redesigned David Rumsey Map Collection website! This continuously growing online collection of maps includes the ability to:

  • Search the entire collection which includes maps from around the globe
  • View maps on Google Earth and Google Maps as georeferenced maps
  • Download images of maps in multiple sizes
  • Purchase print versions of maps
  • Embed maps into your website
  • And much more!

David Rumsey’s Map Collection is absolutely amazing and each map has been digitized with attention to detail that is almost unparalleled in the online map world. Take a few moments to explore this excellent online map collection, you will be glad you did!

Did You Know #18 Natural Earth

We know it is crunch time for many GIS students out there as the semester is nearing the end so try Natural Earth for obtaining Free GIS Data (that’s right Free!) for areas beyond Connecticut. Natural Earth is an online GIS data warehouse which includes public domain map dataset at 1:10m, 1:50m, and 1:110m scales. Data appears to have both a United States and International focus with cultural, physical and raster datasets. The interface is intuitive and easy to navigate based upon our exploration of the site. Check out this site and let us know what you think!


Special thanks to Maps, Air Photo & GIS Forum Listserv for sharing this resource!

Did You Know #17 Bing Maps Beta

Microsoft’ Bing Maps latest release is now officially in beta for users to try. This new version of Bing Maps using the Microsoft Silverlight platform and requires a user to install silverlight before they can use the new interface. Many users might be familiar with the Microsoft Silverlight platform as it is being used to provide access to streaming video content and other interactive media and is similar to Adobe’s flash media player.

Bing Maps Beta includes:
– Streetside View (Similar to Street View in Google Maps)
– Multiple Perspective Aerial Images (just as in the previous version)
– Streetside includes simulated 3D which in dense urban areas provides a realistic view of the area in 3D.
– Navigation controls are easier to find and rotating the image is extremely fast
– Bing Map Apps provide integration for Twitter and other data feeds

Below is a screen shot of Bing Maps Beta taken on December 3, 2009. As you can see the interface is more streamlined, includes weather data, and great color imagery.


For more details visit the Tech Crunch Blog for more details and reviews of Bing Maps Beta.

Did You Know #16 Interactive Timelines

When developing research projects, a timeline of events can be extremely helpful for illustrating the sequence and inter-connectivity of concepts. Dipity is an online resource which enables you to create interactive timelines and includes a timeline, flipbook, list and map view. On the main page the site includes a top news story theme and provides an interactive timeline of events. Below are some examples of the Timeline and Map functions in Dipity related to the H1N1 Vaccine.


The dipity website also enables you to create a login where you can add content from Flickr, and RSS feed, blogs, YouTube, Twitter, and several other sources dynamically. You can even create individual events and add them to the timeline. Once you have created your timeline, post the link to Twitter, Facebook, Myspace, or embed the timeline widget on your own website!

Have fun experimenting with this site and share your feedback with us below.

Special Thanks to Steven Park from the University of Connecticut Learning Resource Center for sharing this link with us.

Map of the Week #7 – Montana 1911

State of Montana – Department of the Interior General Land Office Map – 1911

While searching for maps of Yellowstone National Park, this gorgeous map of Montana was discovered while exploring the map collection at MAGIC. This 1911 map includes Indian Reserves, National Parks, Reclamation Projects and U.S. Land Offices as well as several other features.

This map includes railroad lines and it is clearly visible that the Northern Pacific Railroad has a spur line which provides passengers with access to Yellowstone National Park. The desire to connect Yellowstone via rail is clearly evident in the History of Northern Pacific Railroad by Eugene V. Smalley in1883 which is included below.

Explore this map in the original size view (this may take a few moments to load) and share the amazing features relevant to your research with us by posting a comment.

Map of the Week #6 – Columbus, Ohio

Map Showing the Great Coal Fields, Natural Gas Fields, Steam and Electric Railroads: and All Important Towns, Villages, and Streams Tributary to Columbus Within a Radius of 70 miles

The above map depicts the city of Columbus, Ohio in 1902 in an azimuthal projection with the center focused on the city of Columbus. This unique perspective includes a limited view of the region with a 70 mile range and highlights numerous gas and coal fields along with railroads connecting the region.

A notable location on the map includes the Hocking Coal Fields (southeast of Columbus) which includes New Straitsville, Ohio. This was the site of the 1884 coal miners strike where striking coal miners planned for their strike in Robinson’s Cave, and pushed burning coal cars into a coal mine owned by the New Straitsville Mining Company, setting the mine ablaze.

While not completed until 1903, the Columbus, Delaware, and Marion interurban electric railway is clearly depicted on this map.

There are several other interesting locations on this map. Feel free to share you favorites by including them in the comments for this blog post.

Map of the Week# 5 Chicago’s World Fair 1893

Visitors map created on Rand McNally & Co’s. Map of Chicago 1890

The above map was modified to give visitors to the Worlds Columbian Exposition of 1893(A.K.A. The Worlds Fair) a guide to the city of Chicago and a subtle suggestion as to where to lodge, especially for the Christian visitors.

Notable locations on the map in regard to the Worlds Fair of 1893 are indicated by a red hashed area located in the southeast portion of the map. Details of the Columbian Visitors’ Association’s “South Shore” building and it’s location in relation to the World’s Fair Grounds are illuminated by an inset map set in Lake Michigan.

Above and Below: World’s Fair Grounds 1893


The “South ShoreColumbian Visitors Association

While not the primary focus of the map, many of Chicago’s Parks and Cemeteries are noted on the map in the color of green.

PARKS:
Some well known parks include Lincoln Park and Lake Park.


Left: Lincoln Park, Right: Lake Park

Lincoln Park originally served as a cemetery for the city beginning in 1843 and later became a city park in 1864. Attractions within this park include the Lincoln Park Zoo, a conservatory, and the Peggy Notebaert Nature Museum.

Lake Park, now known as Grant Park was officially named as a park in 1844. Grant Park contains and links many famous Chicago attractions and events. Most notable is the Buckingham Fountain pictured below.

Connected to Grant Park in the northwest corner is Millennium Park which hosts concerts and other events. Millennium Park is also the home of the sculpture Cloud Gate, affectionately referred to as “The Bean” by locals.

Institutions located within close proximity to Grant Park include:

Two of Jeff’s favorite events also take place at Grant Park:

  1. The Taste of Chicago – Usually around the week of the 4th of July.
  2. The Chicago Marathon – This year the start will take place October 11, 2009 at 7:30 a.m. Click here for the course map!

CEMETERIES:
Also noted on the map in the same shade of green as the parks are cemeteries within the city limits. These include:

Graceland Cemetery
Founded 1860


Oakwoods Cemetery
founded 1854

Rosehill Cemetery
founded 1859


Finally, there is one last feature on this map that I’d like to illuminate and share. The Union Stock Yards of Chicago, the source of inspiration for The Jungle published by Upton Sinclair in 1906.

Chicago has a long and interesting history, but this weeks map only provides a snap shot of the city in 1890. Hopefully I’ve covered some of the more interesting features, but I’m sure I’ve missed a multitude of fascinating stories and facts. Please feel free to take up where I’ve left off, there are many more parks, cemeteries, and places of interest left on the map to explore!

Did You Know? #11 Cartography in the News

Political views aside, the following video is entertaining and impressive! Minnesota Public Radio edited and posted this video of Senator Al Franken of Minnesota and it’s worth watching.

Pause the video and compare it the following map provided by National Geographics Xpeditions Atlas page:


Not too bad, how does your geographic knowledge stack up? Click on the picture below to see CNN’s reporter Jeanne Moos provides an entertaining overview of Al Frankens ability. Pay attention to when she asks “can you find New York on a map?”.


If you’re out of practice on naming your states we’ll provide you with some fun online games that will sharpen those rusty skills (Thanks to Veryspatial.com for listing the first 3 links in their excellent blog!):

  • Place the States – In this game you’ll place the state shape where it belongs.
  • Name the States – This game is a little less difficult, just place the state name where it belongs.
  • CIA Worldexplorer – This game covers world geography at various levels and asks you to choose a country based on facts given to you. Good Luck!
  • Maps.Com – This page contains many online map quizzes and map games for different regions around the globe.

Try this quiz from Maps.Com:
<br> <p>Your browser does not support iframes.</p><br>
If you need to study up beforehand, we recommend National Geographics Xpeditions web site. Here you will find a link to an Atlas, Lesson Plans and Activities.

TEACHERS!
We at Outside the Neatline would like to show of your students knowledge of geography and map drawing skills. We would like to see student submissions from elementary school students or classes so we can post their work for the mapping world to see! We will leave the submission date open so that we can highlight your students hard work throughout the year.

You can submit your cartographic masterpieces in one of two ways:

(1) as a digital image attached to an email sent to: jeffrey.dunn@uconn.edu

OR

(2) in the drawings original paper format in the mail addressed to:

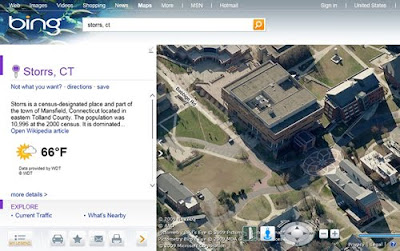
Map and Geographic Information Center (MAGIC)
Homer Babbidge Library
369 Fairfieild Way, Unit 2005
University of Connecticut
Storrs, Connecticut 06269-2005

Any questions or concerns can be answered by email at: jeffrey.dunn@uconn.edu Or by telephone at: (860) 486-4589
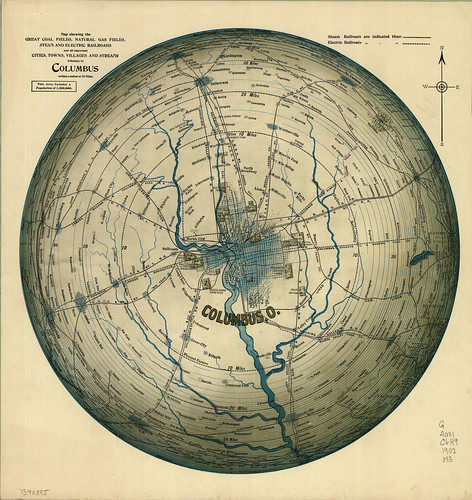
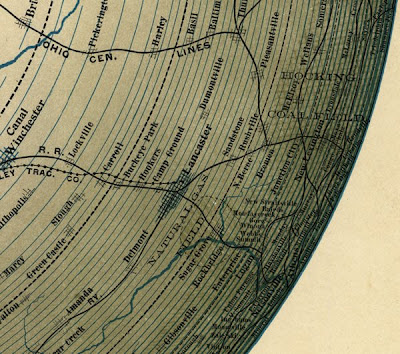
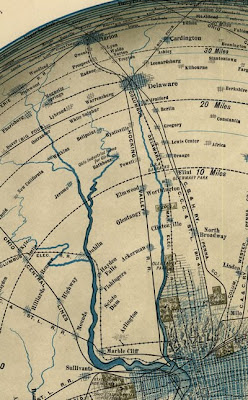
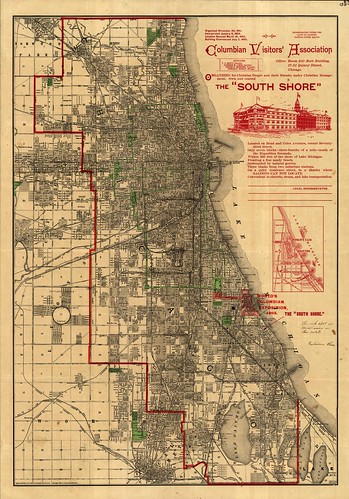
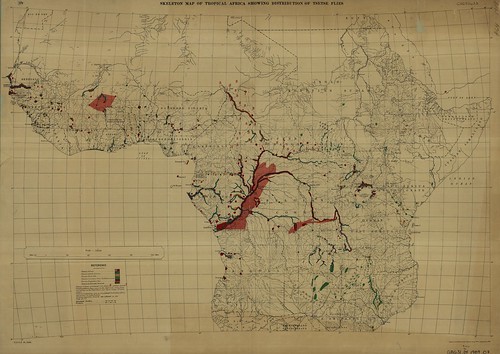
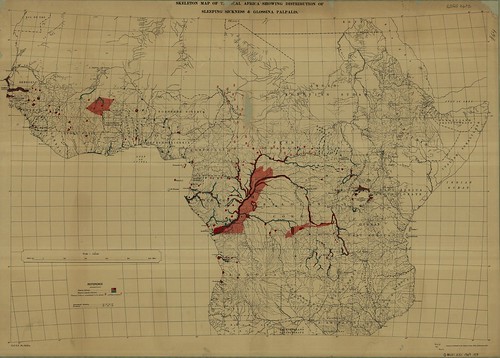
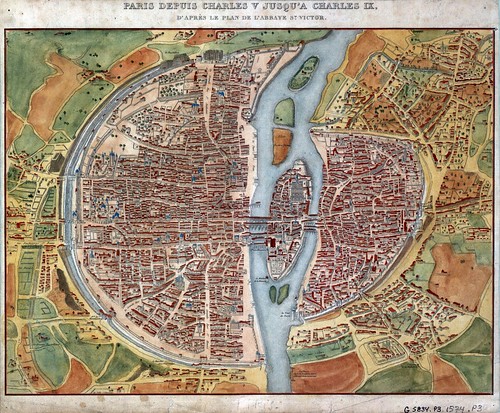
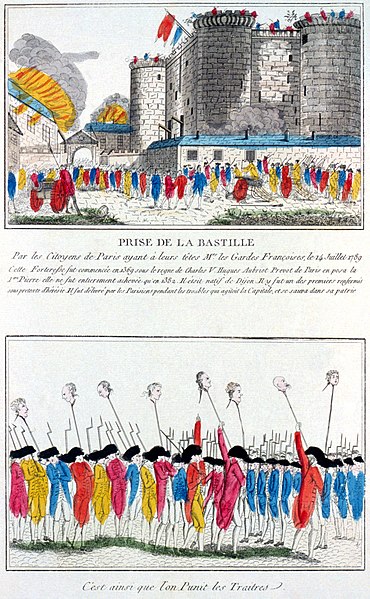
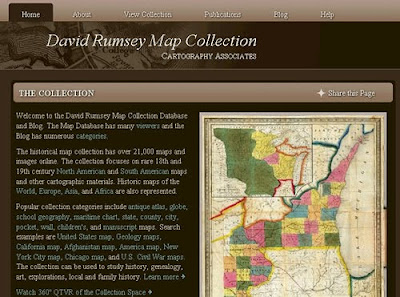
Map of the Week! #5 Sleeping Sickness in Africa 1909

Okay, so maybe there’s two maps this week, but they’re closely related!


Map 1.) Skeletal Map of Tropical Africa Showing Distribution of Tsetse Flies


Map 2.) Skeletal Map of Tropical Africa Showing Distribution of Sleeping Sickness and Glossina Palpalis

Both of these maps were published in 1909 by the Ordnance Survey of Great Britain. Map 1 shows the spatial distribution of Tsetse flies which were discovered to be the vector for the disease sleeping sickness (African Trypanosomiasis).

Tsete flies (Genus Glossina) have several species that exist on the African continent. On Map 1 you can see that there are several species of Glossina listed. These species have slightly different habitats as shown below (click the links for modern day maps, how do they compare to the 1909 maps?):

There are many other species of tsetse flies, for a brief list, click here.

The actual parasite that the tsetse flies act as vectors for is the protozoa Trypanosoma brucei , more specifically African Trypanosomiasis.


Trypansomiasis can be a fatal disease that first causes the lymphnodes to swell, insomnia at night and fatigue by day (hence “sleeping sickness”). For a list of symptoms and stages of the illness click here. It was not until 1902-1903 that it was discovered by Sir David Bruce that the tsetse flies were the vector for this parasitic disease. This cognitive leap must have prompted the mapping of tsetse fly habitats and distribution to predict the occurrence of sleeping sickness and take initial steps in mitigating the disease. Turn of the century GIS!
Oh yeah, if you want some GIS data on tsetse fly distribution, check out this page sponsored by the FAO.

“Hooray for geography and hooray for maps!” I say!

Map of the Week! #4 Paris from Charles V to Charles IX

The title of this weeks featured map is:

Paris depuis Charles V jusqu’a Charles IX, d’après le plan de l’Abbaye St. Victor.
OR

Paris from Charles V to Charles IX, after the plan of the Abbey St. Victor.

That’s quite a long time period. In fact, the end of Charles V reign is dated at 1380 and the beginning of Charles the IX reign is dated at 1560. The additional information in the title referencing that it is after the plan of Abbey St. Victor gives us little help in narrowing down the dates of the map as the abbey was formed circa 1113. Also of note is that this map was published with the text “Tableau de Paris” By Louis-Sébastien Mercier in 1893. This is surely a later revised edition as Louis-Sébastien Mercier passed away in 1814.

To read an edition of this work look below to the embedded Google book. The edition is in French but if you copy the URL of the book and paste it in Google’s Translate tool you should be able to read it in English. (Tip: Set the text to “Plain Text” located in the upper right before translating)

Important features located on the map include Nostre Dame Cathedral now spelled Notre Dame:

St. Victor Abbey:

La Bastille, an icon of royal power that was stormed at the beginning of the French Revolution:

St. Eustache Cathedral with a pipe organ numbering ~8000 individual pipes rivaling the pipe organ in Notre Dame. For photos of St. Eustaches stained glass windows click here.


And Porte Saint-Denis, a fortified gate in the walls of old Paris.

Also for fun, see how many windmills you can find on the map here’s an example: