US Census: Consumer Expenditure Survey

Since 1979, the Census Bureau’s Consumer Expenditure Survey has supplied the nation with household data used to help compute the Consumer Price Index, a key measure of the economy released by the U.S. Bureau of Labor Statistics. In April 2011, the next round of interviews takes place for this quarterly survey. The survey collects information [PDF] on spending for housing, groceries, health care, transportation and other vital goods and services. To see the latest data available and additional details visit: http://www.bls.gov/cex/.

Household Expenditures for Shelter: 2008-2009

Average Annual Amount Spent on Shelter Percent of Total Expenditures
United States $10,129 20.3%
Northeast $11,984 22.0%

New York

$15,482 25.7%

Philadelphia

$13,597 23.9%

Boston

$12,857 21.7%

Wildlife Recreation Information Survey by US Census Underway

On April 1, 2011, U.S. Census Bureau employees began the first wave of data collection for the National Survey of Fishing, Hunting, and Wildlife-Associated Recreation from about 53,000 households across the country.

Conducted every five years by the Census Bureau, the survey is sponsored by the U.S. Fish and Wildlife Service.

“Participation in this survey is important because the results help us better manage our natural resources and to understand the demands being put on our wildlife and their habitat,” said Robert Groves, director of the Census Bureau. “This is one of the many surveys conducted by the Census Bureau for other federal agencies.”

The information collected for this survey focuses on individuals involved in fishing, hunting and other wildlife-associated recreation, such as observation, photography and feeding.

The latest data from the survey show that in 2006, more than 87 million Americans 16 and older enjoyed some form of wildlife-related recreation and spent $122 billion in pursuit of these activities.

The questions ask in which state these activities occurred and focus on such items as the number of trips taken, duration of trips and expenditures for food, lodging, transportation and equipment. Federal and state agencies use this knowledge for conservation efforts and to maintain areas where we go for outdoor recreational activity.

Preliminary survey findings will be available in summer of 2012. The final national report will be issued in the fall of 2012, followed by a report for each state.

Data collection began on April 1, 2011. Respondents will be surveyed primarily by telephone. Residents will receive a letter from Groves informing them of the survey. All information collected is kept strictly confidential and only statistical totals are published.

The National Survey of Fishing, Hunting, and Wildlife-Associated Recreation has been conducted since 1955 and is one of the oldest and most comprehensive continuing recreation surveys.

To view previous survey reports and data visit: http://www.census.gov/prod/www/abs/fishing.html

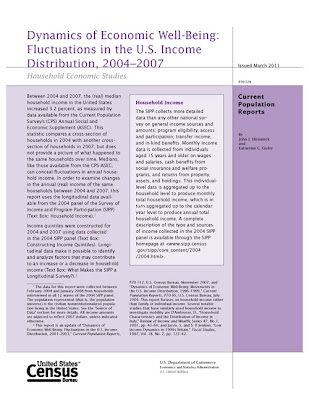
US Census Report: Fluctuations in the U.S. Income Distribution: 2004-2007

This U.S. Census report divides the nation’s 106 million households into quintiles of 21.3 million based on income and compares their characteristics and their movements between and within the quintiles. Using data from the Survey of Income and Program Participation (SIPP), the report traces the changing income levels of a representative sample of U.S. residents over a 48-month period (February 2004 to January 2008). These households were interviewed every four months over this time.

View the full report in PDF format at: http://www.census.gov/prod/2011pubs/p70-124.pdf

2010 Census Redistricting (Public Law 94-171) shapefiles now available

Thanks to the efforts of Jeffrey Dunn & Jie Lin at the Connecticut State Data Center and Will Carnes and Josh Strunk at the UConn Libraries Map and Geographic Information Center – MAGIC, shapefiles are now available for the 2010 U.S. Census Redistricting (Public Law 94-171) dataset for Connecticut. These shapefiles incorporate the data and are available in both Connecticut State Plane NAD 83 and WGS 1984 projections. Included below is a listing of the geographies available for download in shapefile as well as spreadsheet formats.

Each of these shapefiles include FGDC metadata which defines each attribute and users can also download the spreadsheet data which includes a codebook for these attributes. To download these files visit the Connecticut State Data Center’s data download page at:
We would also like to feature maps on the MAGIC and Connecticut State Data Center websites that included 2010 U.S. Census Redistricting (Public Law 94-171) Data created by you! If you have a great map you would like to share email us at ctsdc@uconn.edu.

Get MicroData from the DataFerret!

DataFerret is a tool that mines and extracts data from 4 main types of data:

  • MicroData
  • Aggreagate or Summarized Data
  • Longitudinal Datasets
  • Time Series Datasets

This tool is very easy to use and may be helpful to user of PUMS data.  The program has the ability to export custom tables in a number of different formats and has the ability to create maps.

Check out the following links to get some more background information on the DataFerret and how to make use of this tool:

Here is a sample map of Average Income by PUMA’s in Connecticut, no GIS needed.

ACS 2005-2009 PUMS Data for Average Income

Mean Center of Population Based on 2010 Census data

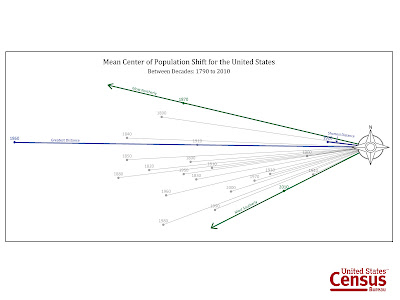
The United States Census Bureau released the Mean Center of Population for the 2010 Census on Thursday, March 24, 2011. Based on the 2010 Census, the Mean Center of Population in the United States is…… 2.7 miles northeast of Plato, Missouri. Included below is a map that shows the the mean center of population from 1790 to 2010:

The US Census Bureau also provided a visualization of the movement of the Mean Center of Population over time with the 2010 Census representing the furthest shift to the south of the Mean Center of Population in the United State since the first census in 1790. Included below is an visualization of the shift from 1790 to 2010:

For additional details on the Mean Center of Population press release visit:

Media Advisory — March 24, 2011 Census Bureau to Hold Webinar Prior to Release of Center of Population and First Two 2010 Census Briefs

The U.S. Census Bureau will hold a media webinar prior to the March 24 release of the final states redistricting data, national mean center of population and release of 2010 Census Briefs on population distribution and race and ethnicity. Reporters will learn the background on race and Hispanic origin concepts and the types of race and ethnic data that will be reported in the upcoming 2010 Census releases. The webinar will consist of a simultaneous audio conference and online presentation. Reporters will be able to ask questions during the audio conference once the presentation is complete.

When:
Tuesday, March 22, 2011, 2 p.m. (EDT)

Who:
Karen Humes, assistant division chief, Special Population Statistics, Population Division
Nicholas A. Jones, chief, Racial Statistics Branch, Population Division
Roberto R. Ramirez, chief, Ethnicity and Ancestry Branch, Population Division

Details:
Audio conference — access information

Toll free number: 888-324-7210
Participant passcode: CENSUS
Questions and answers are limited to media

Online presentation — access information
Please login early, as some setup is required:

URL: https://www.mymeetings.com/nc/join/
Conference number: PW6204276
Audience passcode: CENSUS

Follow us on Twitter, Facebook, Flickr and YouTube (/uscensusbureau).

Media Advisory — Census Bureau Director to Discuss Redistricting Data, Center of Population and 2010 Census Briefs

U.S. Census Bureau Director Robert M. Groves will brief the media on 2010 Census news, releases and products. Groves will discuss quality indicators and the completion of all releases of 2010 Census redistricting data, and he will announce the site of the new national mean center of population. The briefing will include the release of the first two 2010 Census briefs — population distribution, and race and ethnicity — and a question-and-answer session.

When:
Thursday, March 24, 2011, 2 to 3 p.m. (EDT)

Who:
Robert M. Groves, director, U.S. Census Bureau
Nicholas A. Jones, chief, Racial Statistics Branch, Population Division
Marc J. Perry, chief, Population Distribution Branch, Population Division

Where:
National Press Club, 13th floor
Murrow Room
529 14th Street, NW
Washington, DC 20045

Members of the media may also participate by telephone.
(Please dial-in early to allow time for the operator to place you in the call.)

Dial-in number: 888-390-1046
Password: CENSUS
(For security reasons, the passcode will be required to join the call.)

Online Press Kit:
Event materials will be posted online shortly after the event begins and can be accessed by clicking on the 2010 Census Operational Press briefing at http://2010.census.gov/news/press-kits/operational-press-briefing.

Webcast:
There will be a live webcast of the briefing, accessible at http://www.visualwebcaster.com/event.asp?id=77517 at 2 p.m. (EDT) on event day.

Please RSVP by 5 p.m., Wednesday, March 23, to the Public Information Office at 301-763-3030 or to pio@census.gov.

For more information about the U.S. Census Bureau, please visit and follow us on Twitter, Facebook, Flickr and YouTube (/uscensusbureau).

Census Bureau Survey Shows Poverty is Primarily a Temporary Condition

From the U.S. Census Bureau Newsroom:

 Poverty is not necessarily a permanent condition, according to a report released today by the U.S. Census Bureau. While 29 percent of the nation’s population was in poverty for at least two months between the start of 2004 and the end of 2006, only 3 percent were poor during the entire period.
    The report, Dynamics of Economic Well-Being: Poverty, 2004-2006, traces a sample of U.S. residents over the aforementioned 36-month period and examines how many of them were poor during at least some portion of that time and how long their poverty spells lasted. It also looks at how many fell into poverty, how many climbed out of it and how many stayed poor during the period. The data are presented by various demographic and socioeconomic characteristics.
    The data were collected by the Survey of Income and Program Participation (SIPP) between February 2004 and May 2007 from a representative sample of U.S. households who were interviewed every four months during the period. These estimates should not be confused with the official poverty estimates, which are based on the Current Population Survey (CPS) Annual Social and Economic Supplement. The CPS captures a snapshot of well-being at a single point in time. Seehttp://www.census.gov/newsroom/releases/archives/income_wealth/cb10-144.html. Limited data from more recent SIPP interviews are available. Tables on the Census Bureau website (http://www.census.gov/hhes/www/poverty/publications/dynamics04/tables.html) and in the appendix of the report provide some estimates for 2007 and 2009.
    According to the report, poverty can be a persistent condition: among the 33 million people who were poor at the start of the period — January and February 2004 — 23 percent remained poor throughout the next 34 months.
    However, many people did escape poverty: 12 million, or 42 percent, who were poor in the 2004 calendar year were not in poverty in 2006.
    As some moved out of poverty, others moved into it. About 10 million who were not in poverty (4 percent) in 2004 slipped into poverty by 2006.
    Other highlights include:
  • For those who were in poverty for two or more consecutive months from 2004 to 2006, the median length of a poverty spell was 4.5 months. Almost half of such spells ended within four months while about 12 percent lasted more than 24 months.
  • More than half of those who did exit poverty continued to have income that was not significantly above the poverty level (less than 150 percent of the poverty threshold).
  • Children younger than 18 tended to stay poor longer than working-age adults (ages 18-64): the median length of their poverty spells was 5.2 months, while for those 18 to 64, the median was 4.2 months. Older adults (65 and older) had the longest stays in poverty of any age group: a median spell of 6.7 months.
  • People in female-led families had longer median poverty spells than those in married-couple families.

2010 Connecticut Census Data – Quick Facts

On Wednesday March 9, 2011 at 2:00pm the U.S. Census Bureau released the Connecticut redistricting data. This dataset includes total population, race, ethnicity, voting age (18+), and housing occupancy data for multiple geographies in Connecticut. To allow for quick comparisons between 2000 and 2010, the Connecticut State Data Center has created a dual map viewer which enables users to search for a town, click on the town, and view data from 2000 and 2010 side by side. Check out this Connecticut census data viewer!
Included below is a summary of quick facts from this 2010 Census data release for towns in Connecticut based on population increases and decreases from 2000 to 2010:

Connecticut Towns with Largest Increases in Population from 2000 to 2010

Town 2010 Population
1 New Haven, CT 6,153
2 Danbury, CT 6,045
3 Mansfield, CT 5,823
4 Stamford, CT 5,560
5 Bridgeport, CT 4,700
6 Middletown, CT 4,481
7 Norwich, CT 4,376
8 Hamden, CT 4,047
9 Manchester, CT 3,501
10 Southington, CT 3,341


Connecticut Towns with Population Decreases from 2000 to 2010

Town 2010 Population
1 Branford, CT 28,026 (-657)
2 Enfield, CT 44,654 (-558)
3 East Hampton, CT 12,959 (-393)
4 West Hartford, CT 63,268 (-321)
5 Sherman, CT 3,581 (-246)
6 Salisbury, CT 3,741 (-236)
7 Sharon, CT 2,782 (-186)
8 Old Saybrook, CT 10,242 (-125)
9 Bridgewater, CT 1,727 (-97)
10 New Fairfield, CT 13,881 (-72)

More details will be made available soon! Be sure to check out the newly redesigned Connecticut State Data Center website for 2010 Census data and shapefiles.