2011 Characteristics of New Housing Report

2011 Characteristics of New Housing

This report provides annual statistics on the characteristics of new privately owned residential structures for the U.S. and the nation’s four regions — Northeast, South, Midwest and West. The statistics are gathered from the Census Bureau’s Survey of Construction, and the report includes characteristics such as type of wall material, number of bedrooms and bathrooms, type of financing, heating and square footage.


A Few Highlights from the 2011 Report:

  • The average single-family house completed was 2,480 square feet. In 2010, the average single-family house was 2,392 square feet.
  • 33% of the new single-family homes sold in the U.S. had vinyl siding as the principal type of exterior wall material. For attached single-family homes sold, it was 41% and for detached single-family homes sold, it was 32%.
  • 88% of all single-family homes completed had air-conditioning. By region, the proportions were 81% in the Northeast, 91% in the Midwest, 99% in the South, and 62% in the West.
  • 39% of single-family homes completed had 4 or more bedrooms. 48% of them had 3 bedrooms.
  • Of the single-family homes completed with 4 or more bedrooms, 57% had 3 or more bathrooms.
  • 19% of new single-family homes sold had a garage that could hold 3 or more cars.
To explore additional data related to new housing characteristics for 2011, view this report at: http://www.census.gov/construction/chars/

Voting Report: State-Level Maps and Graphs on Voting

Voting Report: State-Level Maps and Graphs on Voting
Check out the Voting Patterns by State
 
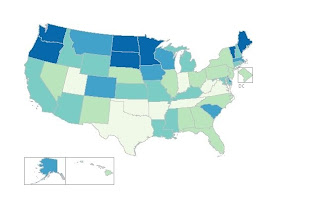
The Census Bureau has released a menu-driven, interactive Web page permitting users to access for any state a series of graphs showing percentages of adults who voted and registered in every congressional and presidential election between 1996 and 2010. In addition to graphs showing voting and registration trends over the period, users may choose a given election year and find separate graphs showing voting and registration by one of the following characteristics: age, sex, educational attainment, and race and Hispanic origin. Some analysis of the 2010 election is provided as well, as are thematic maps of states showing percent voting during each election. The statistics come from the Current Population Survey. 
 
View additional information at the US Census Bureau Voting Registration Voting Hot Report

2011 Annual Survey of State Government Tax Collections – Now Available

The 2011 Annual Survey of State Government has been released by the U.S. Census Bureau which indicates that overall tax collections for states increased $55.7 billion to $757.2 billion in fiscal year 2011, up 9.8%. General sales tax revenue was at $234.5 billion in fiscal year 2011, up 5.4%.

State Government Tax Collections 2011: Connecticut

Within the state of Connecticut, the 2011 Annual Survey of State Government indicates that State Government Tax Collections for Fiscal Year 2011 totaled $13,432,252,000. The following table includes a brief breakdown of the State Government Tax Collections for fiscal year 2011 for Connecticut:

State Government Tax Collections: 2011
(Amounts in thousands)
Item
Connecticut
    Total taxes
13,432,252
Property taxes
X
Sales and gross receipts
5,522,780
   General sales and gross receipts
3,252,123
   Selective sales taxes
2,270,657
      Alcoholic beverages
48,923
      Amusements
409,188
      Insurance premiums
195,968
      Motor fuels
477,772
      Pari-mutuels
7,220
      Public utilities
274,640
      Tobacco products
400,562
      Other selective sales
456,384
Licenses
446,755
   Alcoholic beverages
12,441
   Amusements
128
   Corporation
27,810
   Hunting and fishing
5,565
   Motor vehicle
195,286
   Motor vehicle operators
38,664
   Public utility
704
   Occupation and business, NEC
161,062
   Other licenses
5,095
Income taxes
7,142,062
   Individual income
6,469,246
   Corporation net income
672,816
Other taxes
320,655
   Death and gift
227,237
   Documentary and stock transfer
93,358
   Severance
60
   Other
0

To view (and download) this data and related information on the 2011 Annual Survey of State Government Tax Collections survey visit: http://www.census.gov/statetax

Census Bureau Releases First Information Since 2000 Census on Moves Between Counties

Census Bureau Releases First Information Since 2000 Census on Moves Between Counties

Maricopa, Ariz., Receives Movers From and Sends Them to Largest Collection of Counties

The U.S. Census Bureau released estimates from the American Community Survey showing how many people migrated from one specific county to another during the course of a year ─ the first such numbers published since these data were collected as part of the 2000 Census.

The American Community Survey compiles data over a five-year period and asks people where they lived one year prior to being surveyed. The first five-year estimates released covers the years from 2005 to 2009.

The 2005-2009 American Community Survey County-to-County Migration Files provide tables for each county in the nation, showing both “inflows” and “outflows.” Inflows are the number of people living in a given county who lived in another specific county one year earlier; outflows represent the number of people who lived in a particular county one year earlier who subsequently moved to another specific county.

Of the 48.1 million people who lived in a different residence in the United States one year earlier, 17.7 million lived in a different county.

Maricopa, Ariz., had the largest number of inflows of people for any single county in the nation. People moved there from 993 different counties. Similarly, Maricopa led the nation with the largest number of counties in which it sent outflows of people ─ a total of 1,156 counties. This means that individuals leaving Maricopa were more dispersed throughout the country than individuals leaving any other county. Pinal, Ariz. (13,452 residents); Los Angeles (12,403); Pima, Ariz. (7,349); San Diego (6,693); and Coconino, Ariz. (3,994) were among the counties with the highest number of people moving into Maricopa.

Pinal (21,974), Pima (8,464), San Diego (4,156), Los Angeles (3,813) and Coconino (3,188) were among the counties with the highest number of moves out of Maricopa.

All in all, the most common county-to-county moves nationally were from Los Angeles to San Bernardino, Calif. (48,456 people) and Los Angeles to Orange, Calif. (41,612). Los Angeles to Riverside, Calif. (29,710); Orange, Calif., to Los Angeles (29,345); and Miami-Dade to Broward, Fla. (27,010) were among the next most common county-to-county moves.

Additionally, Los Angeles had both the highest number of people entering from another county as well as the highest number leaving for another county. On balance, however, it lost a net of about 160,000 people in this exchange.

Prior to this product, the only migration flow tables available from the American Community Survey covered state-to-state flows; the latest such release, from the 2010 one-year estimates, was published in November 2011. Later this year, the U.S. Census Bureau plans to release a file from the 2006-2010 American Community Survey five-year estimates showing county-to-county flows by demographic characteristics, such as age, sex, and race and Hispanic origin.

1940 Census – Now Available from National Archives

The 1940 census records were released by the US National Archives April 2, 2012, and brought online through a partnership with Archives.com. The 1940 Census National Archives site allows you full access to the 1940 census images, in addition to 1940 census maps and descriptions. Visit the National Archives site for more details at: http://1940census.archives.gov/

1940 Census Video from National Archives

Additional Resources on the 1940 Census

U.S. Census Evaluation Estimates of the Population for the United States, States and Counties: April 1, 2000, to July 1, 2010

The Census Bureau releases population estimates annually for the United States and Puerto Rico. Every decade, this provides the opportunity to examine these estimates side-by-side with the results of the decennial census. Comparisons of preliminary 2010 estimates and census counts are now available for U.S. states and the Puerto Rico Commonwealth. Comparisons for U.S. counties and Puerto Rico municipios will be made available after all Census 2010 counts are released for these areas. For background on how the estimates were produced, see the Release Notes for Preliminary Vintage 2010 Estimates.

For full methodological detail on the production of population estimates, please refer to Vintage 2009 methodology statements for National, State and County, and Puerto Rico population estimates.

To view complete the complete details on Population Estimates created by the U.S. Census Bureau visit: http://www.census.gov/popest/research/eval-estimates/eval-est.html

2010 Information and Communication Technology Survey Report – Available Now!

The Information and Communication Technology Survey (ICTS), a supplement to the Annual Capital Expenditures Survey (ACES), was created in response to economic data user and policymaker concerns about the lack of available data on e-business infrastructure investment by nonfarm businesses. Rapid advances in ICT equipment result in these assets having short useful lives and being replaced at a much faster rate than other types of equipment. As a result, rather than capitalizing the value of such assets and expensing the cost over two or more years, companies often expense the full cost of such assets during the current annual period. In some cases this same-period expense is also because companies have varying dollar levels for capitalization. Hence, the survey gives users a more complete idea of U.S. companies’ total investment in ICT equipment. The statistics are used to assess future productivity and economic growth prospects and permit the reconciliation of important differences between reported production and consumption of technology.

Companies are expensing the full cost of such assets during the current annual period rather than capitalizing the value of such assets and expensing the cost over two or more years. In some cases this is due to the short useful life of the asset, and in other cases this is because companies have varying dollar levels for capitalization. The ICTS data are critical for providing improved source data to the investment component of gross domestic product, capital stock estimates, and capital flow tables.

The 2010 estimates included in this report are based on data collected from a sample of 46,448 companies with employees. The sample frame for companies with employees was slightly more than 5.7 million. Check out the full report at: http://www.census.gov/econ/ict/xls/2010/full_report.html

The chart above is from the 2010 Information and Communication Technology Survey Summary of Findings report which is available at: http://www.census.gov/econ/ict/xls/2010/summary_of_findings.html

Census Releases New Website for Research – Research @ Census

New on the Census Bureau Website: Research@Census 
The newly created Research@Census website is a gateway to the world of research at the Census Bureau. This site enables users to learn about innovations to measure and understand America through improved statistics, statistical products and analysis. 
Also included on the site is a new blog “Research Matters” that features the work of researchers from all areas of the Census Bureau. Research ranges from substantive topics of interest in demography, economics and other social sciences to methodological questions, such as the role of statistical modeling in surveys, designs for the 10-year census, research on record linkage and confidentiality protection. Census Bureau researchers include geographers, statisticians, economists, demographers and more.
Check out the new site at: http://www.census.gov/research/ 

2010 Census Urban Areas Now Available

On Monday, March 26, 2012, the Census Bureau announced the list of urbanized areas and urban clusters defined on the basis of the 2010 Census. The official announcement occurred via the Federal Register, with the notice providing lists of urbanized areas and urban clusters and their respective 2010 Census populations.

In conjunction with the announcement, the Census Bureau’s Geography Division released the following items:

  • Lists of urbanized areas and urban clusters with 2010 population, land area, and population density;
  • Urbanized area/urban cluster TIGER/Line shapefiles
  • Updated 2010 census block shapefiles with urban/rural flag and urban area code
  • Files providing relationships between urbanized areas/urban clusters and counties, places, county subdivisions, ZCTAs, and metro/micro areas;
  • A 2010 urban area to 2000 urban area relationship file;
  • Census 2000 to 2010 Census population and land area change for urbanized areas
  • Urban/rural population by state
  • Urban/rural population by county
  • Thematic maps:
    • Distribution of urbanized areas and urban clusters
    • New urbanized areas
    • Percentage of population that is urban by county
    • Percentage of population in urbanized areas by county
    • Ten most populous urbanized areas

These items and other information about the Census Bureau urban-rural classification and urban area delineations can be found on the Census Bureau’s website at http://www.census.gov/geo/www/ua/2010urbanruralclass.html.

For details an overview of the urban areas data release, view the U.S. Census Press Release.

Redesigned Census.gov website now available

Do you use the U.S. Census website and have had difficulties locating data and resources? If so then be sure to check out the newly redesigned census.gov website which has greatly improved access to data, maps, and statistics from the U.S. Census Bureau! 
As the first step to making Census content more accessible, useful, and interesting for our users today the U.S. Census Bureau has redesigned Census.gov.  The goal of this redesign is to make it easier for users to find information and to increase public awareness of how the Census measures people, places, and the economy.
Here are some of the new features and tools users will experience:
  • A prominent dashboard showing off the Census Bureau’s economic indicators
  • A top dropdown menu for quick navigation to key topics
  • A new interactive map showing a mash up of economic and demographic statistics
  • A “Stat of the Day” highlighting Census Bureau statistics across all the data we collect
  • A mega footer with links categorized under familiar topics and highly trafficked pages
  • A feature for users to provide feedback

As the U.S. Census Bureau continues to transform census.gov, the public will gain greater accessibility to U.S. Census Bureau statistics through both their desktops and mobile devices. Users will see additional improvements in search, topic-based navigation, visualizations and digital content.