Fourth Quarter 2010 Data for US Manufacturing, Mining, Wholesale Trade, and other industries


The latest version of the U.S. Census Quarterly Financial Report is now available. For over sixty years, the Quarterly Financial Report – QFR program has collected and published quarterly aggregate statistics on the financial results and position of U.S. corporations. This report includes:

  • Corporations that have a plurality of business activity in manufacturing industries, and domestic assets of $250,000 and over.
  • Corporations that have a plurality of business activity in mining, wholesale trade, retail trade, or selected service industries, and domestic assets of $50 million and over.
  • Corporations that are above industry specific receipt cut-off values.
  • The statistical data are classified by industry and by asset size.
  • Currently, the QFR program covers the following industry sectors, as defined by the North American Industry Classification System (NAICS):
    • Mining 211-213
    • Manufacturing 311-316, 321-327, 331-337, 339
    • Wholesale Trade 423-425
    • Retail Trade 441-448, 451-454
    • Selected Service Indistries 511-512, 515, 517-519, 541 (except 5411 Legal Services)
To view the 4th Quarter 2010 Quarterly Financial Report for Manufacturing, Mining, Wholesale Trade, and Selected Service Industries visit: http://www.census.gov/econ/qfr/

US Census: Consumer Expenditure Survey

Since 1979, the Census Bureau’s Consumer Expenditure Survey has supplied the nation with household data used to help compute the Consumer Price Index, a key measure of the economy released by the U.S. Bureau of Labor Statistics. In April 2011, the next round of interviews takes place for this quarterly survey. The survey collects information [PDF] on spending for housing, groceries, health care, transportation and other vital goods and services. To see the latest data available and additional details visit: http://www.bls.gov/cex/.

Household Expenditures for Shelter: 2008-2009

Average Annual Amount Spent on Shelter Percent of Total Expenditures
United States $10,129 20.3%
Northeast $11,984 22.0%

New York

$15,482 25.7%

Philadelphia

$13,597 23.9%

Boston

$12,857 21.7%

Wildlife Recreation Information Survey by US Census Underway

On April 1, 2011, U.S. Census Bureau employees began the first wave of data collection for the National Survey of Fishing, Hunting, and Wildlife-Associated Recreation from about 53,000 households across the country.

Conducted every five years by the Census Bureau, the survey is sponsored by the U.S. Fish and Wildlife Service.

“Participation in this survey is important because the results help us better manage our natural resources and to understand the demands being put on our wildlife and their habitat,” said Robert Groves, director of the Census Bureau. “This is one of the many surveys conducted by the Census Bureau for other federal agencies.”

The information collected for this survey focuses on individuals involved in fishing, hunting and other wildlife-associated recreation, such as observation, photography and feeding.

The latest data from the survey show that in 2006, more than 87 million Americans 16 and older enjoyed some form of wildlife-related recreation and spent $122 billion in pursuit of these activities.

The questions ask in which state these activities occurred and focus on such items as the number of trips taken, duration of trips and expenditures for food, lodging, transportation and equipment. Federal and state agencies use this knowledge for conservation efforts and to maintain areas where we go for outdoor recreational activity.

Preliminary survey findings will be available in summer of 2012. The final national report will be issued in the fall of 2012, followed by a report for each state.

Data collection began on April 1, 2011. Respondents will be surveyed primarily by telephone. Residents will receive a letter from Groves informing them of the survey. All information collected is kept strictly confidential and only statistical totals are published.

The National Survey of Fishing, Hunting, and Wildlife-Associated Recreation has been conducted since 1955 and is one of the oldest and most comprehensive continuing recreation surveys.

To view previous survey reports and data visit: http://www.census.gov/prod/www/abs/fishing.html

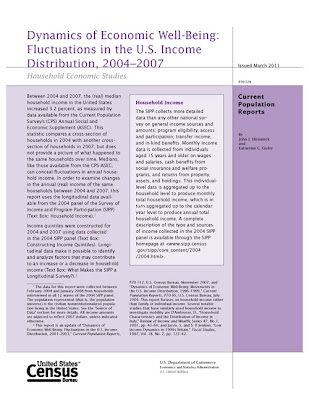
US Census Report: Fluctuations in the U.S. Income Distribution: 2004-2007

This U.S. Census report divides the nation’s 106 million households into quintiles of 21.3 million based on income and compares their characteristics and their movements between and within the quintiles. Using data from the Survey of Income and Program Participation (SIPP), the report traces the changing income levels of a representative sample of U.S. residents over a 48-month period (February 2004 to January 2008). These households were interviewed every four months over this time.

View the full report in PDF format at: http://www.census.gov/prod/2011pubs/p70-124.pdf

Technology Survey for Undergraduates @ UConn

Are you a tech-friendly undergraduate? If so, we are conducting a survey to find out what technologies you use and prefer. Taking the short survey could net you a $50 gift certificate to the Co-op!

Note: Participants must be 18 years or older and currently enrolled at the University of Connecticut as an undergraduate to participate in this survey.

2010 Census Redistricting (Public Law 94-171) shapefiles now available

Thanks to the efforts of Jeffrey Dunn & Jie Lin at the Connecticut State Data Center and Will Carnes and Josh Strunk at the UConn Libraries Map and Geographic Information Center – MAGIC, shapefiles are now available for the 2010 U.S. Census Redistricting (Public Law 94-171) dataset for Connecticut. These shapefiles incorporate the data and are available in both Connecticut State Plane NAD 83 and WGS 1984 projections. Included below is a listing of the geographies available for download in shapefile as well as spreadsheet formats.

Each of these shapefiles include FGDC metadata which defines each attribute and users can also download the spreadsheet data which includes a codebook for these attributes. To download these files visit the Connecticut State Data Center’s data download page at:
We would also like to feature maps on the MAGIC and Connecticut State Data Center websites that included 2010 U.S. Census Redistricting (Public Law 94-171) Data created by you! If you have a great map you would like to share email us at ctsdc@uconn.edu.

May 3-4, 2011 – GIS & Public Health Conference

Registration is now open for the 7th Annual GIS & Public Health Day to be held at the University at Albany School of Public Health in Rensselaer, NY on May 3, 2011. The theme of the conference is “GIS and Community Health Planning” and this year’s keynote presentation “All Public Health is Local: The Community Perspective on GIS and Public Health” is to be given by Dr. Russell Kirby from the University of South Florida.

Registration and additional details on this event are available at: http://www.albany.edu/sph/cphce/gis_2011.shtml

Participants can also register for training day sessions to be held on May 4, 2011 at the University at Albany School of Public Health in Rensselaer, NY

If you have any questions about the conference, they can be sent to the School of Public Health Center for Public Health Continuing Education at: coned@albany.edu

Teaching with Spatial Technology Workshop (TwiST) workshop June 28-30, 2011

Want to engage your students in activities that will have them asking questions and thinking critically about content you cover in your educational environment? At the Teaching with Spatial Technology Workshop (TwiST), K-12 and college educators will learn how to teach with ArcGIS, GPS and other geospatial technologies in their educational environments. Participants will collect and gather data for a community mapping project while learning how to connect to state standards.

Celebrating its 10th year, TwiST will be held June 28-30, 2011 at Cayuga Community College in Auburn, NY. Registration is $250 before May 3 ($275 after May 3). The fee includes: 3-days of training, lunch, a notebook of materials, data, the opportunity to obtain an discounted geospatial software and tools, and approximately $1,000 worth of additional GIS learning resources. Both Graduate and Undergraduate credit is available for an additional fee.

The registration deadline for TwiST is May 3 for the discounted rate. Visit www.iagt.org/twist for registration and additional information.

Get MicroData from the DataFerret!

DataFerret is a tool that mines and extracts data from 4 main types of data:

  • MicroData
  • Aggreagate or Summarized Data
  • Longitudinal Datasets
  • Time Series Datasets

This tool is very easy to use and may be helpful to user of PUMS data.  The program has the ability to export custom tables in a number of different formats and has the ability to create maps.

Check out the following links to get some more background information on the DataFerret and how to make use of this tool:

Here is a sample map of Average Income by PUMA’s in Connecticut, no GIS needed.

ACS 2005-2009 PUMS Data for Average Income

April 8, 2011 – A Talk about Geospatial Law and Public Policy with Peter C. Schreiber

A Talk about Geospatial Law and Public Policy with Peter C. Schreiber
Managing Attorney, Esri
(Environmental Systems Research Institute, Inc., www.esri.com)

Friday, April 8, 1-3pm

Yale Law School, Room 122

Pete will discuss current and future legal and public policy implications facing geospatial technology, the GIS industry, and GIS users.

The discussion will focus on the expanding application of geospatial technology relative to contracts and licensing law; tort law including mission critical applications and navigational guidance; software patents, “copyrightability” of GIS data and the battle between copyright and public records laws; the availability of geospatial data in the post-9/11 era under FOIA and Public Records acts; the 4th Amendment and GPS tracking and redistricting; geopolitical boundary controversies; geo-locational privacy; and the potential legal liability risk exposure that these topics bring. This presentation should prove to be very thought-provoking.

Q&A session to follow.

Speaker Bio

Peter C. Schreiber is the Managing Attorney for the Contracts and Legal Services Department of Environmental Systems Research Institute, Inc. (Esri). He is Guest Lecturer at the GIS Master Program at the University of Redlands, and has also been an Adjunct Professor at the University of California, Riverside Extension and where he has developed and taught a class entitled The Digital Information Age: Law and Public Policy that explores GIS and other high technology-related legal issues. He is currently working on a legal casebook tentatively entitled Geospatial Law and Public Policy. One federal government agency considers him one of the top three legal practitioners in the area of map law in the country.

Mr. Schreiber is a member of the State Bar of California and the American Bar Association, and a member of the Intellectual Property Law sections of each organization. His practice areas include intellectual property, licensing, data rights, and related transactional business matters including mergers and acquisitions. He received his Juris Doctorate from the McGeorge School of Law, University of the Pacific in Sacramento, California, and has a Bachelor of Science degree with an emphasis in Marketing Management from the Walter A. Haas School of Business Administration, University of California, Berkeley.

Co-sponsored by Yale Law School & The Yale Information Society Project

http://www.law.yale.edu/intellectuallife/informationsocietyproject.htm

to download a copy of this announcement in Word Doc format, CLICK HERE.