Connecticut Geo-Focus Newsletter – Spring 2011

The latest issue of the Connecticut Geo-Focus newsletter is now available. In this issue you will find articles and updates on the following topics:

  • Huge GIS Savings
  • The Tourism Map
  • CT Libraries and Job Centers Are Mapped
  • Newtown GIS
  • Geo-Tidbits
  • CT Trust for Historic Barns Survey
  • Vernon Saves Money Using GIS this Winter
  • Cost Sharing Partnership in 2011 Orthoimagery Project
  • CT 2010 NAIP 4Band Ortho-photography
  • Happy Birthday U2U
  • ESRI Technical Certification
  • ArcGIS Online Community Basemap Program
  • and more!

Mean Center of Population Based on 2010 Census data

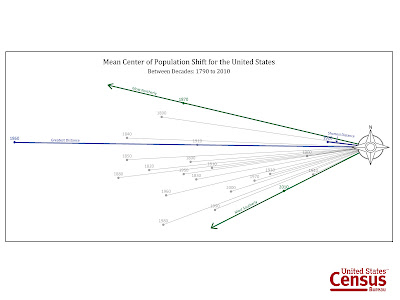
The United States Census Bureau released the Mean Center of Population for the 2010 Census on Thursday, March 24, 2011. Based on the 2010 Census, the Mean Center of Population in the United States is…… 2.7 miles northeast of Plato, Missouri. Included below is a map that shows the the mean center of population from 1790 to 2010:

The US Census Bureau also provided a visualization of the movement of the Mean Center of Population over time with the 2010 Census representing the furthest shift to the south of the Mean Center of Population in the United State since the first census in 1790. Included below is an visualization of the shift from 1790 to 2010:

For additional details on the Mean Center of Population press release visit:

March 24, 2011 – A Talk about OpenStreetMap.org with Founder, Steve Coast

A Talk about OpenStreetMap.org with Founder, Steve Coast
Thursday March 24th, 2011, 6-8pm
Yale Law School, Room 127
Steve Coast is the Founder of OpenStreetMap, a free editable map of the world, and Principal Architect at Microsoft’s Bing Mobile. GIS users at Yale and elsewhere will be familiar with OpenStreetMap.org as a “go to” source for the most complete geographic data for both developed and underdeveloped parts of the globe.
During the response to the 2010 Haiti earthquake, OpenStreetMap.org and CrisisCommons.org volunteers used available satellite imagery to map the roads, buildings and refugee camps of Port-au-Prince in just two days, building “the most complete digital map of Haiti’s roads.” The resulting data and maps have been used by organizations providing relief aid, such as the World Bank, the European Commission Joint Research Centre, the Office for the Coordination of Humanitarian Affairs, UNOSAT and others.
At Midnight, Tuesday, March 15th, 2011, the OpenStreetMap user base numbered 371,657, with over 2.2 billion GPS points uploaded.
Steve’s talk will focus on his work with OpenStreetMap.org and his interest in emerging methods of geographically organizing data and search capabilities.
Q&A session to follow.
For more info on Steve Coast, see: http://www.stevecoast.com/
For more info on OpenStreetMap, see: http://www.openstreetmap.org
For more info on CrisisCommons, see: http://crisiscommons.org
Co-sponsored by Yale Law School & The Yale Information Society Project
to download a copy of this announcement in Word Doc format, CLICK HERE.
Sorry for any duplication of this posting if you have seen this from email lists or other sources.

Media Advisory — March 24, 2011 Census Bureau to Hold Webinar Prior to Release of Center of Population and First Two 2010 Census Briefs

The U.S. Census Bureau will hold a media webinar prior to the March 24 release of the final states redistricting data, national mean center of population and release of 2010 Census Briefs on population distribution and race and ethnicity. Reporters will learn the background on race and Hispanic origin concepts and the types of race and ethnic data that will be reported in the upcoming 2010 Census releases. The webinar will consist of a simultaneous audio conference and online presentation. Reporters will be able to ask questions during the audio conference once the presentation is complete.

When:
Tuesday, March 22, 2011, 2 p.m. (EDT)

Who:
Karen Humes, assistant division chief, Special Population Statistics, Population Division
Nicholas A. Jones, chief, Racial Statistics Branch, Population Division
Roberto R. Ramirez, chief, Ethnicity and Ancestry Branch, Population Division

Details:
Audio conference — access information

Toll free number: 888-324-7210
Participant passcode: CENSUS
Questions and answers are limited to media

Online presentation — access information
Please login early, as some setup is required:

URL: https://www.mymeetings.com/nc/join/
Conference number: PW6204276
Audience passcode: CENSUS

Follow us on Twitter, Facebook, Flickr and YouTube (/uscensusbureau).

Media Advisory — Census Bureau Director to Discuss Redistricting Data, Center of Population and 2010 Census Briefs

U.S. Census Bureau Director Robert M. Groves will brief the media on 2010 Census news, releases and products. Groves will discuss quality indicators and the completion of all releases of 2010 Census redistricting data, and he will announce the site of the new national mean center of population. The briefing will include the release of the first two 2010 Census briefs — population distribution, and race and ethnicity — and a question-and-answer session.

When:
Thursday, March 24, 2011, 2 to 3 p.m. (EDT)

Who:
Robert M. Groves, director, U.S. Census Bureau
Nicholas A. Jones, chief, Racial Statistics Branch, Population Division
Marc J. Perry, chief, Population Distribution Branch, Population Division

Where:
National Press Club, 13th floor
Murrow Room
529 14th Street, NW
Washington, DC 20045

Members of the media may also participate by telephone.
(Please dial-in early to allow time for the operator to place you in the call.)

Dial-in number: 888-390-1046
Password: CENSUS
(For security reasons, the passcode will be required to join the call.)

Online Press Kit:
Event materials will be posted online shortly after the event begins and can be accessed by clicking on the 2010 Census Operational Press briefing at http://2010.census.gov/news/press-kits/operational-press-briefing.

Webcast:
There will be a live webcast of the briefing, accessible at http://www.visualwebcaster.com/event.asp?id=77517 at 2 p.m. (EDT) on event day.

Please RSVP by 5 p.m., Wednesday, March 23, to the Public Information Office at 301-763-3030 or to pio@census.gov.

For more information about the U.S. Census Bureau, please visit and follow us on Twitter, Facebook, Flickr and YouTube (/uscensusbureau).

MAGIC Server Outage – 3/18/2011 at 4:00am

The University of Connecticut Libraries Map and Geographic Information Center – MAGIC server will be updated on March 18, 2011 from 4:00am – 7:00am in order to replace a failing drive. During this outage the Map and Geographic Information Center – MAGIC website will be unavailable. During this outage users can access some content included on MAGIC’s website from the following sources:

– Aerial Photography for Connecticut from CT ECO
– MAGIC’s Historical Maps Collection via Flickr
– Census Boundary files and Data for Connecticut from the Connecticut State Data Center
– GIS shapefiles for Connecticut from the Connecticut Department for Environmental Protection.

We apologize for any inconvenience this outage may cause our users and have scheduled this outage at a time that will impact the least amount of our users. We anticipate our website to be online by 8:00am on Friday March 18, 2011.

Census Bureau Survey Shows Poverty is Primarily a Temporary Condition

From the U.S. Census Bureau Newsroom:

 Poverty is not necessarily a permanent condition, according to a report released today by the U.S. Census Bureau. While 29 percent of the nation’s population was in poverty for at least two months between the start of 2004 and the end of 2006, only 3 percent were poor during the entire period.
    The report, Dynamics of Economic Well-Being: Poverty, 2004-2006, traces a sample of U.S. residents over the aforementioned 36-month period and examines how many of them were poor during at least some portion of that time and how long their poverty spells lasted. It also looks at how many fell into poverty, how many climbed out of it and how many stayed poor during the period. The data are presented by various demographic and socioeconomic characteristics.
    The data were collected by the Survey of Income and Program Participation (SIPP) between February 2004 and May 2007 from a representative sample of U.S. households who were interviewed every four months during the period. These estimates should not be confused with the official poverty estimates, which are based on the Current Population Survey (CPS) Annual Social and Economic Supplement. The CPS captures a snapshot of well-being at a single point in time. Seehttp://www.census.gov/newsroom/releases/archives/income_wealth/cb10-144.html. Limited data from more recent SIPP interviews are available. Tables on the Census Bureau website (http://www.census.gov/hhes/www/poverty/publications/dynamics04/tables.html) and in the appendix of the report provide some estimates for 2007 and 2009.
    According to the report, poverty can be a persistent condition: among the 33 million people who were poor at the start of the period — January and February 2004 — 23 percent remained poor throughout the next 34 months.
    However, many people did escape poverty: 12 million, or 42 percent, who were poor in the 2004 calendar year were not in poverty in 2006.
    As some moved out of poverty, others moved into it. About 10 million who were not in poverty (4 percent) in 2004 slipped into poverty by 2006.
    Other highlights include:
  • For those who were in poverty for two or more consecutive months from 2004 to 2006, the median length of a poverty spell was 4.5 months. Almost half of such spells ended within four months while about 12 percent lasted more than 24 months.
  • More than half of those who did exit poverty continued to have income that was not significantly above the poverty level (less than 150 percent of the poverty threshold).
  • Children younger than 18 tended to stay poor longer than working-age adults (ages 18-64): the median length of their poverty spells was 5.2 months, while for those 18 to 64, the median was 4.2 months. Older adults (65 and older) had the longest stays in poverty of any age group: a median spell of 6.7 months.
  • People in female-led families had longer median poverty spells than those in married-couple families.

2010 Connecticut Census Data – Quick Facts

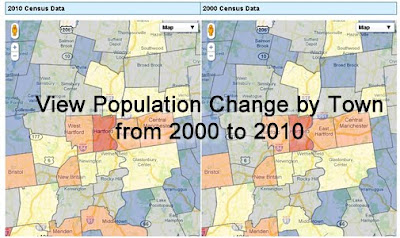
On Wednesday March 9, 2011 at 2:00pm the U.S. Census Bureau released the Connecticut redistricting data. This dataset includes total population, race, ethnicity, voting age (18+), and housing occupancy data for multiple geographies in Connecticut. To allow for quick comparisons between 2000 and 2010, the Connecticut State Data Center has created a dual map viewer which enables users to search for a town, click on the town, and view data from 2000 and 2010 side by side. Check out this Connecticut census data viewer!
Included below is a summary of quick facts from this 2010 Census data release for towns in Connecticut based on population increases and decreases from 2000 to 2010:

Connecticut Towns with Largest Increases in Population from 2000 to 2010

Town 2010 Population
1 New Haven, CT 6,153
2 Danbury, CT 6,045
3 Mansfield, CT 5,823
4 Stamford, CT 5,560
5 Bridgeport, CT 4,700
6 Middletown, CT 4,481
7 Norwich, CT 4,376
8 Hamden, CT 4,047
9 Manchester, CT 3,501
10 Southington, CT 3,341


Connecticut Towns with Population Decreases from 2000 to 2010

Town 2010 Population
1 Branford, CT 28,026 (-657)
2 Enfield, CT 44,654 (-558)
3 East Hampton, CT 12,959 (-393)
4 West Hartford, CT 63,268 (-321)
5 Sherman, CT 3,581 (-246)
6 Salisbury, CT 3,741 (-236)
7 Sharon, CT 2,782 (-186)
8 Old Saybrook, CT 10,242 (-125)
9 Bridgewater, CT 1,727 (-97)
10 New Fairfield, CT 13,881 (-72)

More details will be made available soon! Be sure to check out the newly redesigned Connecticut State Data Center website for 2010 Census data and shapefiles.

Connecticut Town Population 2010 & 2000 Interactive Map Now Available

The Connecticut State Data Center has just released an interactive map to allow users to view 2000 and 2010 Census data for Connecticut towns. This map viewer allows users to search for a Connecticut Town, click on the town to view population, race/ethnicity, voting age, and housing data for 2010 on the map on the left and the user can view 2000 Census data for the town in the map on the right.

The 2010 data was released on 3/9/2011 at 2:00pm and we are still enhancing this mapping interface and we welcome your feedback! Check out this interactive map by visiting the Connecticut State Data Center’s website and click on the Maps link or click the image below
Users can also download this data in spreadsheet (Microsoft Excel format) and in shapefile formats directly from the Connecticut State Data Center’s data page.